.png)
Maxwell's UI - MXweb
ColorSet Details √A wealth of information is available when analyzing individual track measurements.
Results Tab
The Results Tab provides visual results of the measurement in several forms:
Target View
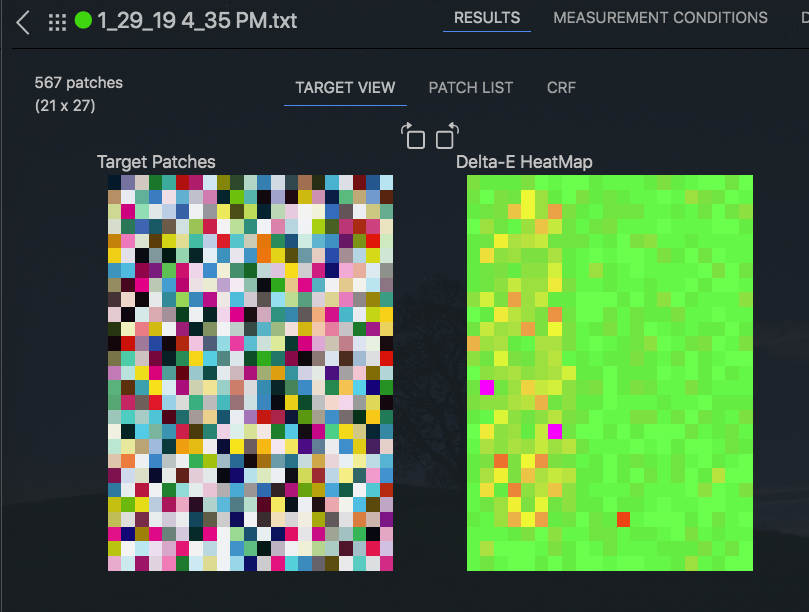
Target View presents a “heatmap” which shows the results of the measurement in the same layout that was present on the original measured sheet. This is useful for identifying any printing problems that are related to the geometry of the printed page. The Target View is instrumental in the Digital PressWatch service of Maxwell. Here a target printed over the entire width of the press can help to visually identify variations in color consistency across the print path. If a problem is happening with the gripping edge, or trailing edge, or a worn roller or blanket, the issue will show up in the Heatmap.
CHROMiX has specially prepared targets for use on 9 inch, 11 inch, 12 inch presses, and more.
The example at right demonstrates what a Digital PressWatch target would look like identifying a worn blanket on an Indigo digital printer.
The scale of colors runs from green (for good) to magenta (for poor).

More options:
The total number of patches in the target is displayed along with the layout of the columns and rows.
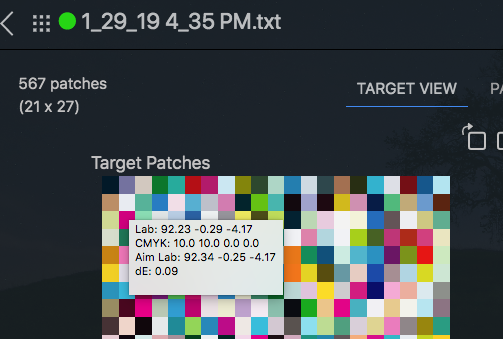
Device values (RGB or CMYK) are displayed along with the Lab values of the color aim.
The Lab values of the measurement are shown for comparison.
The dE comparison between the measurement and the color aim for this patch is displayed.
Double+clicking again on any color in the target will:
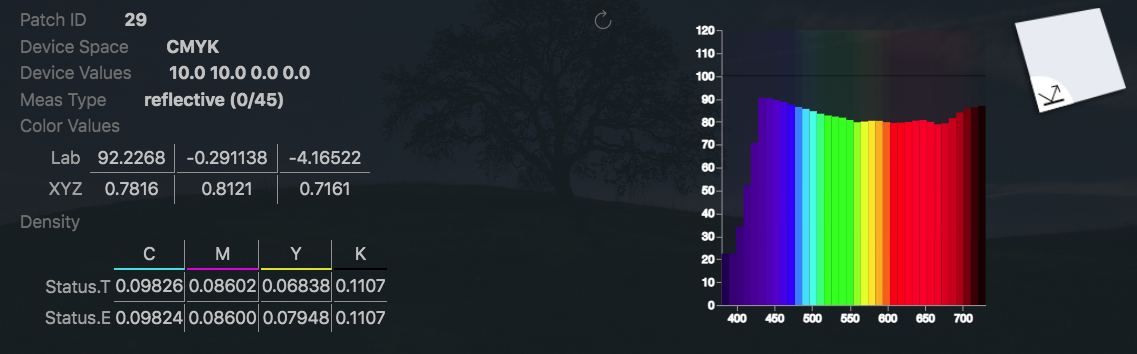
Open up the color detail
Show a histogram of the color
Show Lab and XYZ information
Show density information in Status T and Status E (if spectral info is present in the measurement)
Patch List
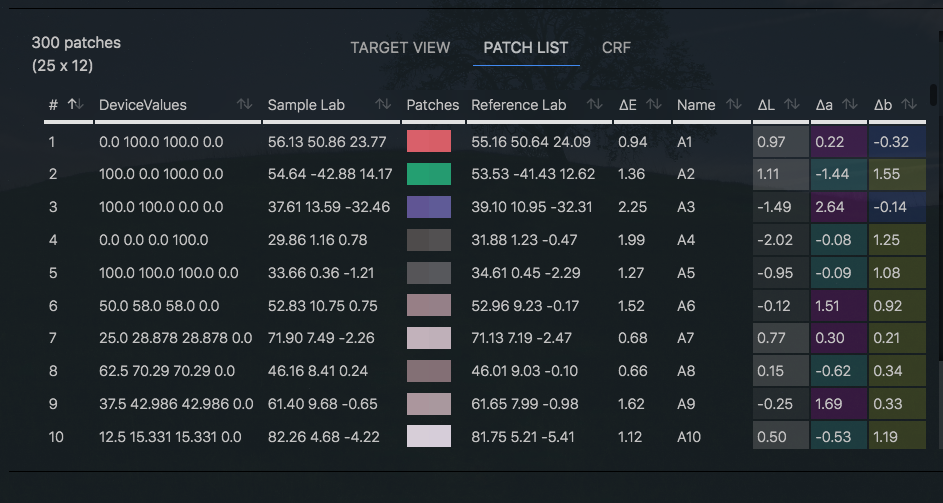
The Patch List provides a direct comparison between the reference patches and the corresponding sample patches. This includes:
Lab values for each sample patch
Actual representative colors for each patch. (All the colors shown in Maxwell are taken from the actual color data itself, converted to sRGB in order to be viewed correctly on internet browsers.)
The name for each color (as defined by the reference set that was used.)
A delta E column showing the precise difference between each reference and sample patch.
Delta L, delta a, delta b columns to aid in quickly identifying in which direction the color difference is located. These columns are also color-coded to represent the quadrant of color in which the value is found. (For example: +a to -a or +b to -b.)
Sorting
Note that each of these columns are able to be sorted. Here are some examples of how to use this powerful feature:
Click on the "∆ E " column header, and all of the colors in the list are sorted according to smallest to the largest dE values. Clicking the dE heading again will sort them all from highest to lowest. This is very useful for quickly determining the worst colors and identifying common characteristics.
Click on the "DeviceValues" header to order the list according to device values. You can quickly identify if your color list contains duplicate patches.
Click on the one of the Lab headers to sort all patches according to luminosity.
By default the Patch to Patch comparison matrix is sorted according to patch order in the reference file. To return to this sorting, click on the # heading over the left-most column.
CRF Tab
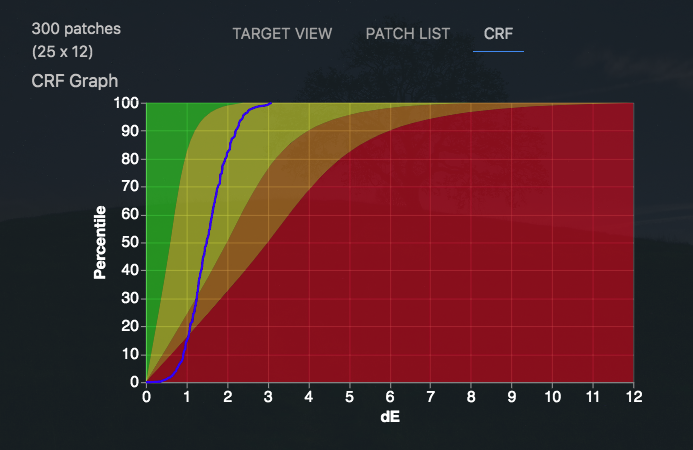
CRF (Cumulative Relative Frequency) is another tool to help determine the overall error distribution of a target’s patch error.
The blue line represents the measurement result.
The red, yellow and green zones represent closeness to the left axis, which is the ideal.
Ideally the good measurement will be as close to the left axis as possible.
How the CRF is calculated
Each patch's dE value is placed in a list that is sorted from lowest to highest. The patch's rank in the list is expressed out of 100 (ie percentile). The line in a CRF graph shows each patch's dE value (x / horizontal axis) vs its rank (y / vertical axis)
Note that a CRF graph does not have any special calculations beyond the dE calculation itself. It merely shows all the errors stacked up.
The 95th percentile value shows up in the graph at 95%.
Metric Results Summary
The Metric Results Summary gives a quick view of all the metrics results tracked in the measurement.
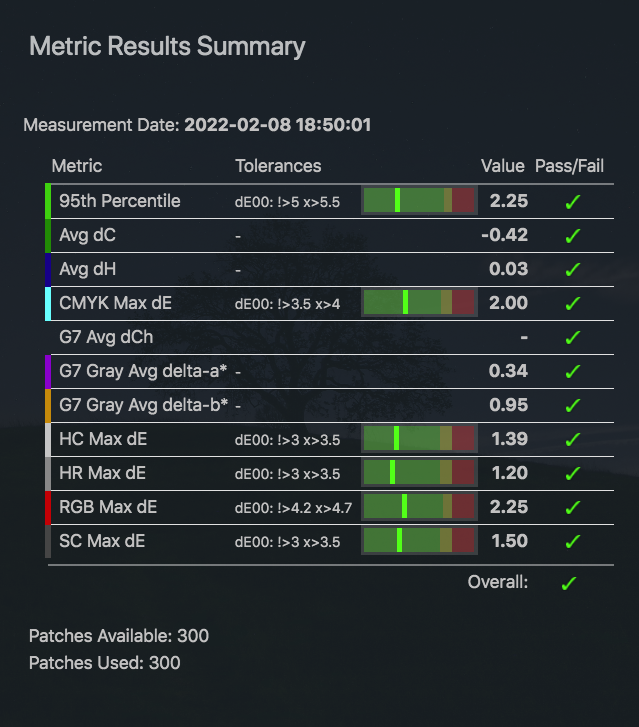
This is generally the same view as is seen after measuring in the Maxwell Client.
Tolerances with “warning” and “critical” levels are shown.
The bar graph gives an easy to read visual of where the measurement lies in relationship to the warning and failure levels.
Pass / fail results for each metric is displayed with a green √ checkmark or a red X.
Channels
Channels uses SmartTargetTM technology to:
Find single-ink patches
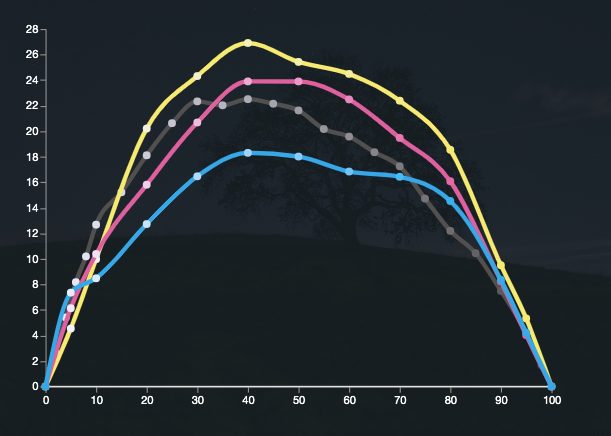
Automatically calculate dot gains (using the calculation engine in CHROMiX's ColorThink Pro software.)
Note: Channel Report requires CMYK data. (It will not work with RGB data.)
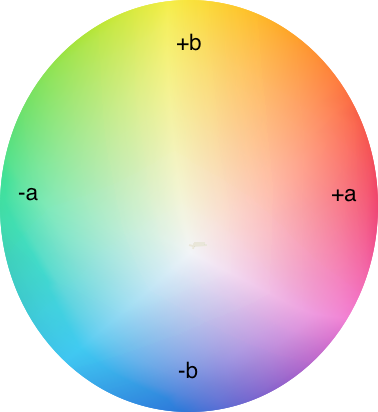
a/b Graph
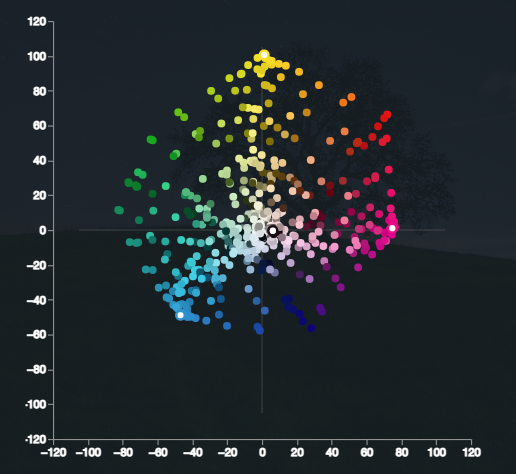
The a/b Graph is a representation of the color set as it would be seen in Lab colorspace. This is a 2-dimensional view of the measurement colors mainly showing hue and saturation. Lightness is also represented in muted or brighter colors.
Measurement Conditions
Measurement conditions show the conditions in place when the measurement was taken. Theoretically any of these conditions may have an effect on the results of the measurement, so a thorough knowledge of what went into making the measurement is essential to developing a consistent workflow.
Measurement Conditions include:
Light filter mode (M0, M1, M2, M3) according to ISO 13655
Aperture size
Scanning mode (reflective or transmissive emissive, or illuminant)
Measurement backing of white, black or the natural color of the media
Number of measurements per patch
Control of the scan by continuous scan or patch-by-patch
Whether the instrument is required to be calibrated for each use.
Scanning instruments differ greatly in their form and function. These options are not available or applicable for all instruments.
A similar list of measurement conditions is set in the color aim. If desired, certain specific measurement conditions can be required by an administrator to ensure consistency in regular measurements.
Details
The Details tab displays additional information about the individual measurement.
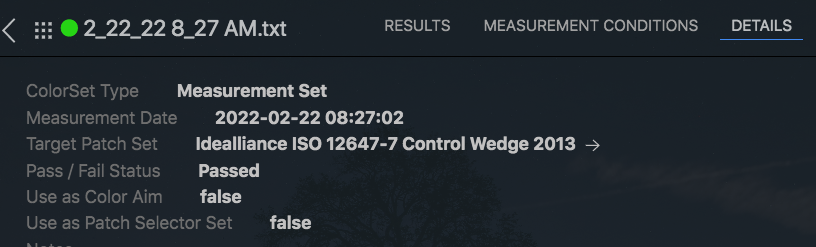
Target Patch Set
If Maxwell recognizes the patch set as a common industry chart, it will display the Target Patch Set.
Use as Color Aim
Change this field from false to “true” if this measurement is to be included in a list of color aims available for a reference set.