.png)
Metrics, Tolerances & Reporting
Metrics
Metrics are the different forms of measurement data which Maxwell calculates for your tracks. Examples of some Maxwell metrics are:
Average delta E
Maximum delta E
Minimum delta E
Media delta E
Standard Deviation
Average delta E - worst 10%
Average delta E - best 90%
Maxwell will automatically calculate and retain the results for these seven metrics with each measurement it collects - even if they are not specified in your Metric Details pane.
Some metrics of interest:
Media delta E tracks the white point only, so you can see if your media is changing (and can also be an indication of your measurement repeatability.)
Standard Deviation is a measure of how widely distributed the measurements are from the average. It is worthwhile checking standard deviation on measurement data, since average delta E by itself will not show you how widely varied those measurements are.
Worst 10% / Best 90% reports on the average of the worst 10% of patches or the average of the best 90%.
Average/Max Delta H returns the average/maximum of the delta Hue - how far apart is the hue component only.
Average/Max Delta C returns the average/maximum of the delta Chroma - the color saturation component.
Maximum Delta L returns the maximum difference in lightness.
G7 Metrics return the result of pass/fail of the G7 specification, according to the indicated compliance level (G7 Grayscale, Targeted, or ColorSpace).
Creating Metrics
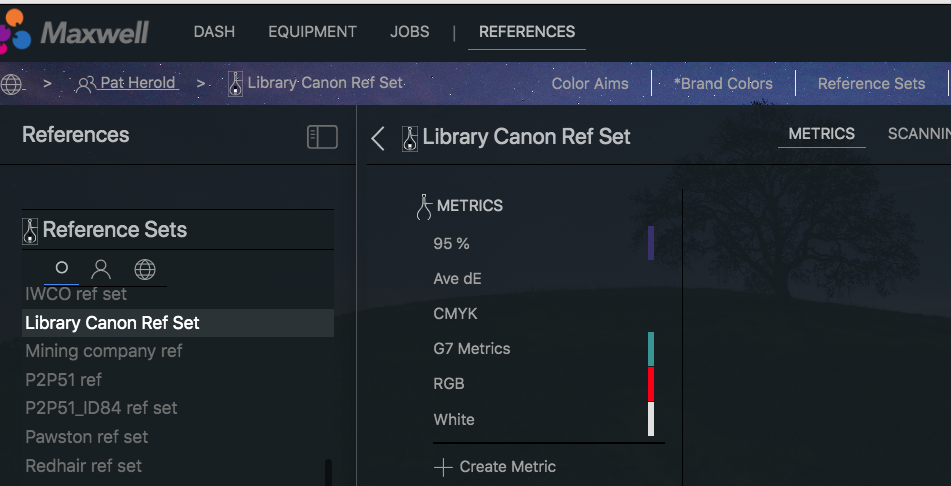
Metrics are part of a Reference Set which is found in the top tab marked REFERENCES.
A reference set will contain the measurement file you are using as a color aim (sometimes known as a reference file), and the Metrics that are associated with this Reference Set.
Click + Create Metric
Click the + Create Metric button to open up the Metric dialog.
Many users find it helpful to create at least an "average deltaE" metric and a "maximum deltaE" metric.
NOTE: At least one metric is required in order to view a trend report.
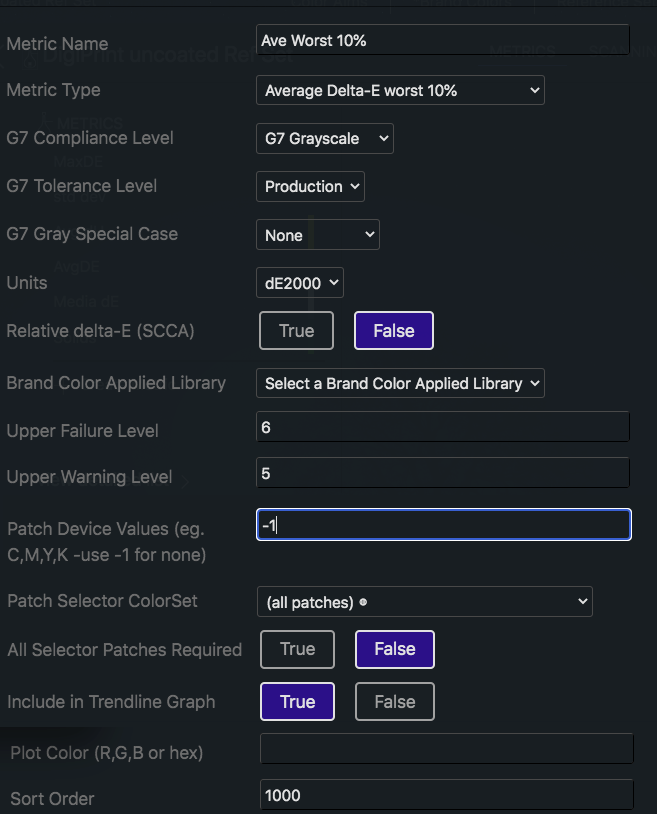
Give the metric an identifying name (Metric Name)
Select what kind of metric it is (Metric Type)
The G7 fields are for metrics relating to the G7 specification
Choose calculation method under "units" (deltaE 76 or dE 2000)
(The CIELAB2000 Color Difference Equation is a ellipsoidal color difference scale similar to CMC.)
Upper Failure Level determines the threshold at which a measurement will fail. This is like a red traffic light requiring your production to stop until a problem is corrected. A Notifier is triggered for this track (when a notifier is enabled.) For example, a value of 6 on a 'Maximum deltaE' metric for a display track would trigger an email notifier when a new profile is uploaded which contains any colors greater than 6 delta E from the color aim.
The Upper Warning Level will give a “yellow light” kind of warning. This is to indicate that the measurement does not fall outside of your critical tolerances, but is a warning that the color is getting close to failure.
Patch Device Values: It is possible to create a metric that tracks specific device values. For example, if you wish to track the results of measuring the 50, 40, 40, 0 CMYK patch in a target, specify that here.
Enter the RGB or CMYK values in order to engage this feature.
Each value must be separated by a comma
Continue giving the metric a name, choosing a metric type, and choose the correct units as usual
For individual device values, it makes no difference what metric type is used since only one color is involved. (We recommend using Maximum delta E.)
"-1" is the default. This disables the use of individual patch values.
Patch Selector Colorset: It is also possible to choose a subset of colors of a larger target for use as a metric. For example you could choose to track how well a printer is able to consistently print flesh tones.
Upload a measurement set consisting of the colors you wish included in the subset. (This should be in the CGATS format with either RGB or CMYK device values for each color.)
Go into the Color Set Details of this new measurement set and choose an option under Patch Selector Set:
PatchCode - identifies the list of colors by the numerical PatchCode.
Names - identifies the list of colors by the name of the uploaded measurement set.
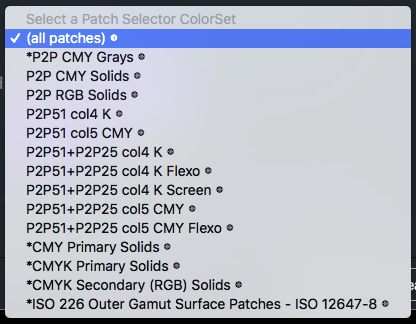
In the "Metric Details" pane, choose the appropriate patch set that appears in the drop down box under "Patch Selector ColorSet."
The default is "(all patches)."

Plot color: Maxwell will automatically assign contrasting colors to the actual trend line depending on how many metrics you have listed.
If desired, a specific color can be assigned to this metric in the trend line by using this field.
Enter a specific red, green, blue number, or a specific hexadecimal number in order to have a specific color show up in the trend line plot for this metric. For example, if you are trending a specific CMYK patch with a single metric, you may wish to choose an RGB equivalent color to represent that in the plot of the trend line.
Click Create button when done.
Note that Maxwell has many powerful features, and not every feature needs to be used on every printing system.