.png)
Graph Control
The Graph Control floating window contains all the functions for the overall control of the Grapher. If you want to affect the display of individual plot items, see Plot Items.
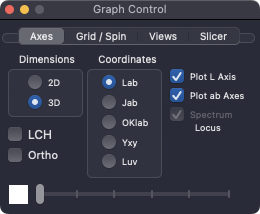
Dimensions - 2D and 3D
Click 2D or 3D to quickly move between the simplified overhead view and the more informative 3D view. The 2D view differs from simply viewing 3D from the top by compressing all details into a single plane and by removing profile surfaces, leaving only the gamut projections for comparison. To include the gamut surfaces in 2D mode, check the Device Gamut Surface for one-time single-item display or uncheck Hide Gamut Surfaces in 2D in ColorThink’s preferences.
LCH Mode New in 4 
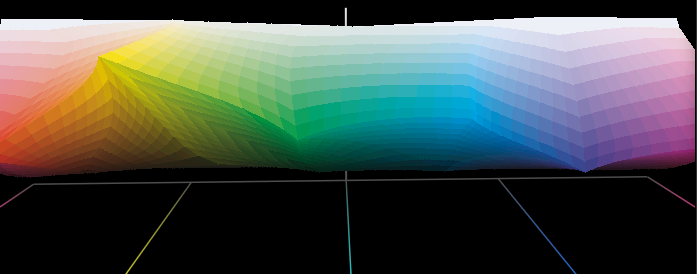
LCH is a new visualization option where Grapher unfolds the 3D graph into a rectangular representation of Lightness, Chroma and Hue. Instead of Hue being represented in a circular manner as it is in Lab, it is stretched out in a line. Profiles, data sets and other files can be viewed from a very different perspective. For example, relative saturation levels can be easily compared against a straight line.
Orthographic (Ortho) Mode New in 4 Pro Feature
Perspective Mode (Ortho off)
By default, Grapher displays using a Perspective view - similar to how humans view the world - with closer objects appearing larger and distant objects smaller. The perspective view enhances the 3 dimensional look and feel of graphed objects. The perspective effect is especially evident when viewing the background grid in Grapher.
Orthographic Mode
The Orthographic viewing mode represents the space without perspective shifting. It’s particularly useful when making more precise, analytical visual judgments about a gamut’s shape. For example, when viewing a gamut from the side or from above in 3D, a more precise rendering of its shape is seeing using the orthographic mode. Also, any comparison between two gamuts in Grapher is unchanged by the relative distance between any elements in Grapher.
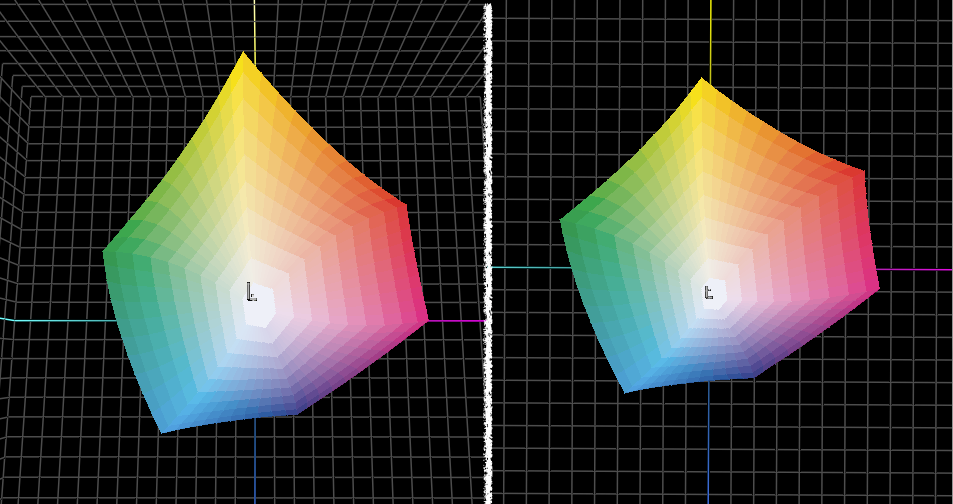
Perspective mode (default) | Orthographic mode
Coordinates
Lab
The Lab color space is the default graphing space in ColorThink’s Grapher. It’s specifically chosen as it’s also used as the PCS (Profile Connection Space) for ICC profiles.
The Lab color space (technically CIEL*a*b*) is an effective space for visualizing color, and has been an industry standard for decades. However, it does have some flaws. Most notably, the saturated blue section of the Lab gamut is distended and curved toward the warmer sections.
In addition to Lab space, there are newer alternatives to Lab space, using advanced color science to un-warp Lab options to view using some new 3D graphing models. These options give many gamuts a more regular shape, and may provide a more accurate representation of the shape of gamuts and the relative relationship between colors:
Jab New in 4 Pro Feature
Jab comes from the world of CIECAM (the CIE’s Color Appearance Model). Jab takes into consideration ambient light levels, the color and brightness of the area surrounding color, and other parameters.
OKLabNew in 4 Pro Feature
OKLab is gaining popularity in the design world, most notably for its use in easily calculating color gradients without undesirable hue shifts. Two sample color lists are included with ColorThink: Blue-White Lab.txt and Blue-White OKLab.txt. Try loading them both into Grapher and switching between Lab and OKLab coordinates to see the difference between straight hue lines and constant hue lines
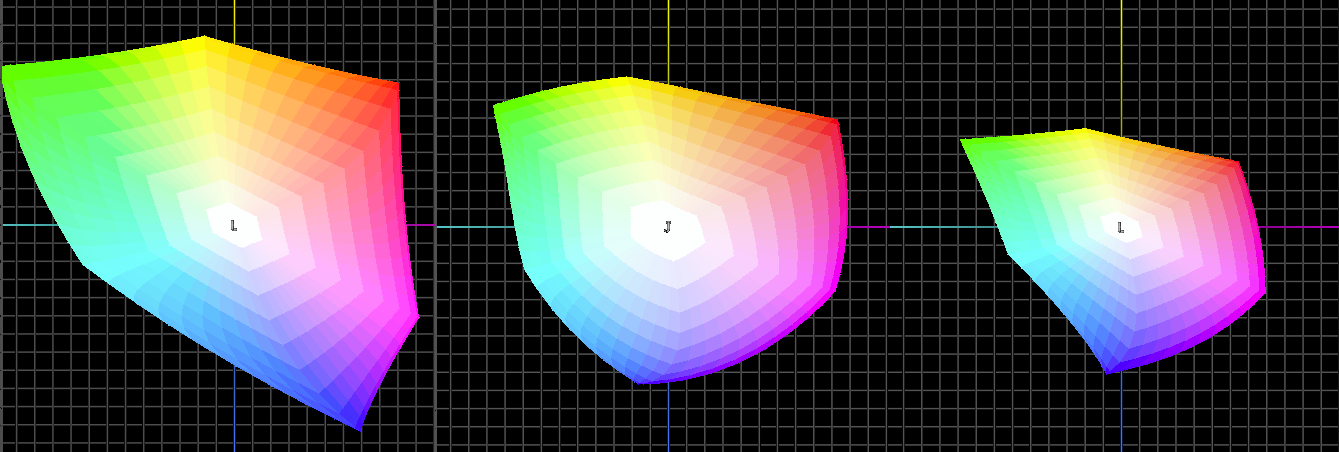
AdobeRGB in Lab | Jab | OKlab
Yxy & Luv
Yxy and Luv chromaticity-style color spaces hark back to pre-Lab (1976) gamut and color visualizations. That’s not to detract from their usefulness today as they are effective at graphing simplified views of RGB monitor spaces (triangles) and other common comparisons.
While it’s common to view Yxy and Luv as 2D graphs, Grapher also includes the ability to view them in 3D mode. We recommend however, that if you like the 3D view, you should seriously consider using Lab (or Jab or OKLb) instead as the concept of equal perceptual differences really doesn’t apply to chromaticity graphing. Distance between colors, lengths of vectors and relative gamut surface shapes are misleading in 3D chromaticity graphs.
Grid & Spin
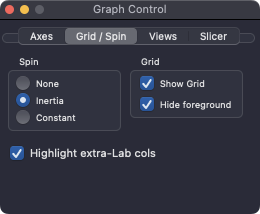
At the Grid/Spin tab, turn grid lines on or off, including the foreground grid if desired. Hiding the foreground grid makes it easier to see details in a profile, for example, without the grid obscuring the field of view. Capturing and compressing pictures and videos can often be done with a smaller file size when the grid is turned off. Type the “G” key to toggle the grid’s visibility.
Spin Control
The spinning of the plot items in the graph can be controlled several ways:
None: Plot items can be “grabbed” and rotated by clicking on the graph window and dragging left-right or up-down. The plot items will not rotate on their own, however.
Inertia: Plot items can be rotated as in “None” but if the mouse button is released while moving, the plot items will continue to rotate at the speed at which they were released. (Default setting) Use the <- and -> arrow keys on the keyboard to “nudge” the display left and right. Each nudge will increase the rate of rotation.
Constant: Plot items will continue to rotate at a constant speed in one direction.
See GrapherHelp for full details about keyboard shortcuts and mouse control of Grapher
Views New in 4
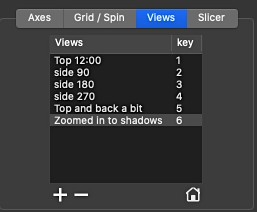 ColorThink 4 allows the saving of the precise positioning of the 3D Grapher. This makes it easy to get to a favorite vantage point when viewing a profile or a color list.
Set Grapher’s rotation, zoom and position where desired
Click the + button
Double+click the default name to create a new name for this view.
Graph Views allow the saving of precise perspectives within Grapher including zoom, rotation perspective and higher / lower positions.
Click the home icon to return to Graphers default position, the R key also works at any time to Reset to this position.
Note that this saving of views does not save the other settings in Grapher. Dimension choices, coordinates, colors and other settings are not saved but can be chosen in addition to saved Views.
The first 9 views automatically have a number key assigned to them, so that any can be selected merely by tapping the appropriate number on the keyboard. Drag the views to reorder them, assigning different views to the 9 number keys
Slicer
 The Slicer provides another way to view how different gamuts interact with each other. With the slicer turned on, a horizontal or vertical plane is "sliced" through the center of the plot area. This allows the viewing of a profile, color list or image pixels at various sections of the color gamut. For example, individual pixels in an image can be compared to the gamut of the printer to be used.
The slice plane can be shaded if desired.
Mac only: Concentric chroma rings can be added to help visualize equal distances from the center of the color space. Chroma rings are not available on the Windows version of the software.
The Lightness slider control can be moved up or down to slice through different sections of the plot area. The horizontal 'slice' thickness is approximately 3 L-values thick (From L-1 to L+2). The thickness cannot be adjusted.
When used with profiles, the top of the profile above or in front of the slice is invisible.
When used with color lists or images, the slicer shows a narrow section immediately surrounding the slice point. With a horizontal slice, everything above and below the slice becomes invisible. With a vertical slice everything in front of the slice becomes invisible.
Vertical Slicer New in 4
 ColorThink 4 can now slice through a vertical plane as an alternative to slicing through the horizontal plane.
Fine control of the Slice
Besides using the Slicer L* slider, the slicer can be moved up and down (horizontal) & around the hue gamut (vertical) using the arrow keys on the keyboard.
Command+Up Arrow and Command+Down Arrow (Mac) will move the slicer up or down by 1 L* value.
Shift+Down Arrow (Mac) will move the slider down by 1/4 L* increments.
Up Arrow and Down Arrow moves the slider up or down by 1 L* value on Windows systems.