.png)
Plot Items
Multi-part Plot Items New in 4 
Each ICC profile, image, or color list added to the Grapher creates a new Plot Item in the Plot List. Selecting a plot item and making any of the changes listed below will work as expected. For more control, each plot item can be opened by clicking its disclosure triangle to reveal sub-items and you can also create additional sub-items as you like.
Some data types automatically create their own sub-items:
ICC Profiles - if a profile contains its originating measurement colors (an optional but common occurrence), Grapher will automatically find and add this list to the profile’s plot item as an unchecked sub-item. Comparing profile gamut surfaces to their original training colors is a common method of double-checking a profile before use in production. Now it’s a single click to add the training data to the graph.
Image Files - if an image contains an embedded ICC profile (also an optional but common occurrence), Grapher will automatically find and add this profile to the image’s plot item as an unchecked sub-item. Embedded profiles define the colors of an image and its maximum gamut boundary. Now it’s a single click to add the image’s profile gamut to the graph, illustrating this important concept.
To Add plot Items
Drag the icon representing the item (color, color list, image, or profile) onto the Grapher window either from within ColorThink or directly from a file browser.
Choose an item from the “+” popup menu located immediately below the “Plot Items” listbox.
Click the 2D or 3D Grapher button on the menu bar of the Color Assets, Profile Inspector or choose Open in Graph from the Worksheet.
Click the Measure button to open the Measurement window, connect to a device, and measure colors directly into the Grapher. Note: these colors are not saved to your hard drive. If you want to save them, double-click the color list so it opens in the Worksheet, then click the popup immediately above the list, and save it from there.
Click the Gear/Action menu to add sub-items to the currently-selected plot item. Most of the sub-item choices are available by choosing
New sub plot itemand then changing its settings, but selecting them directly will have Grapher set them up for you.Click the Maxwell icon to select items directly from Maxwell, which Grapher will then download and display automatically.
Note: The + menu contains a list of Samples to make it easy to access many popular industry profiles and color lists. To add files to this Samples area, place them in the following folder:
Win C:\Users\{my user name}\AppData\Roaming\CHROMiX\ColorThink\Samples
Mac {User home}/Library/Application Support/CHROMiX/ColorThink/Samples
Images, color lists, folders and and shortcuts to other folders can also be placed within this Samples area to customize it to your particular needs.
To Remove Plot Items
Select the plot item from the Plot Item list and press the Delete key or click the - icon.
To Show or Hide Plot Item
Check or uncheck the box to the left of the plot item in the Plot Item Listbox.
Checking the box will also select the plot item. Unchecking a box will not select the plot item.
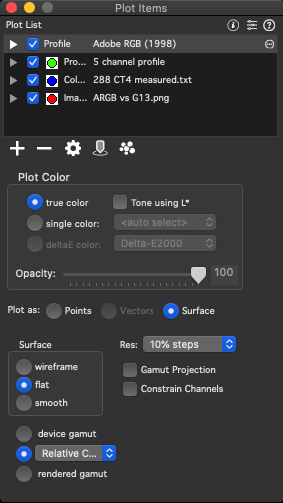
Setting Plot Item Colors
Highlight an item in the plot list
Select:
True Colors All color points and vertices are colored using the actual Lab color values processed through the current monitor profile. Colors outside the gamut of the monitor will be plotted as the closest possible color (using the relative colorimetric rendering intent and the current CMM). Colors outside of the Lab space (defined in ColorThink by the PCS size, L* 0-100, a* and b* -128 to 127) might be plotted with inverted colors, depending on whether
Highlight extra-Lab colsis checked in the Grid/Spin tab of the Graph Control floater.Single Colors All colors in the plot item will be colored using a single color hue. The next available single color will be selected for the plot item. To change the plot color, select a different color from the adjacent popup menu.
Delta-E Coloring (available in Vector mode only).
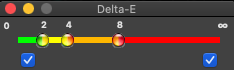
Delta-E coloring will color vectors (depicting color differences) of a plot item with green/yellow/orange/red depending on the amount of color shift depicted by the vector. To change the criteria for the error levels at which the color changes occur, select the “Delta-E Colors” tab and move the sliders in the color bar of the Delta-E floater. In this manner you can select your shop-standard error levels and evaluate color shifts according to your own standards. In general, delta E 2000 is a more accurate choice for small differences. CMC 1:1 and CMC 2:1 are generally intended for use in the garment industry.
Note that while the Delta E coloring will change, the apparent length of the vectors in the Grapher will not change. The default Lab space presented in the Grapher is by definition "delta-E 76" space, and the actual visual space within the Grapher cannot change. ColorThink provides the Delta-E coloring option for a quick visual display of color errors.
Tone using L* (Lightness)
For true-color accuracy, ColorThink darkens the colors plotted according to the Lightness (L* component of Lab) value of each color. This can cause dark colors to become invisible against dark backgrounds. Uncheck this box to remove the darkening effect and lighten the dark portion of the plot item. The colors are less accurate but details in shadow colors may be much more visible (depending on your background)
Tone using Chroma (single-color items) New in 4
When items have a single-color, ColorThink also desaturates the colors according to the Chroma (Saturation) value of the color. This gives some indication about relative color placement. Uncheck this box to remove the de-saturation effect and ensure all parts of the plot item show with the same saturation - this is especially useful for comparing near-neutral colors of different plot items.
Plotting as Points, Vectors, and Surface
Different types of plot items may be plot-able in different forms, depending on the available color data within and what you’re wanting to visualize.
See the following sections for more about plotting in these different forms: