.png)
Working with Workflows
Adding Workflows
A new Worksheet window automatically adds the first workflow. Opening an image or color list places it in the first transform of this first workflow
A new workflow is automatically added to the worksheet when a second image or color list is opened or dropped onto the worksheet. Each separate source of color starts its own workflow.
To create a new workflow that uses the previous workflow’s data source, click the + button in the workflow region. This is effective for applying different profiles to the same source data.
Example Worksheet
For instance, if you are comparing two input profiles using an image:
Open the image into ColorThink. ColorThink opens the image into a new Worksheet and displays its embedded profile in the Profile region.
Drag the first profile into the profile region above the image, assigning it to the image.
Click the
button in the Workflow region. ColorThink creates a new workflow in the worksheet and reopens the image from Workflow 1.
Drag the second profile into the profile region above the image in Workflow 2.
Now the effects of two input profiles can be visually compared using the same source image. This also works on color lists. Turn on delta-E to have ColorThink calculate the difference between the two profiles’ rendering of the image colors.
Adding profiles to a workflow
To add profiles to a workflow:
Drag a profile from another ColorThink window or the Finder / File Manager onto the image or colors region of the workflow.
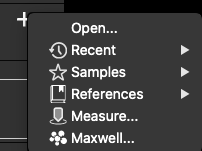
OR click the + button at the right edge of the workflow’s Workflow region and navigate the menu to select or open the desired profile.
Note: Dragging a profile into the profile region of a workflow will replace the current profile, “assigning” the profile to the colors or image. See “Assigning a Profile” in the glossary for more information on this important distinction.
Only profiles can be added to a workflow. Adding color lists or images to workflows actually creates a new workflow with the list or image as its source data.
Delta E comparison
Clicking the deltaE icon ![]() will open a comparison between two different points in the Worksheet. This powerful tool can be used to compare between the starting point where a pixel enters the workflow, to any point in the workflow as laid out in the Worksheet. Possible uses include:
will open a comparison between two different points in the Worksheet. This powerful tool can be used to compare between the starting point where a pixel enters the workflow, to any point in the workflow as laid out in the Worksheet. Possible uses include:
Selecting deltaE formulae
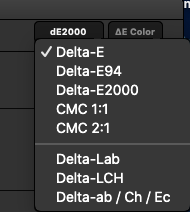 When the delta-E column is displayed, the delta-E Units and delta-E Coloring popup menus are also available. ColorThink allows the selection of several different delta-E formulae depending on your preference. Selecting a new formula will cause an immediate recalculation of all values.
The color differencing formulae available in ColorThink are:
Delta-E 1976
Delta-E 94
Delta-E 2000
CMC 1:1
CMC 1:2
Delta-Lab
Delta-LCH
Delta-ab / Ch / Ec
Note: Altering the delta-E formula doesn’t affect the length or distribution of vectors in the Grapher. As the Grapher works in D50 Lab, all graphed color differences are effectively delta-E 1976 which is the simple calculation of the 3D distance between any two points. Delta-E coloring however, will alter the color-coding of the vectors drawing your attention to the shifts which are likely to cause the most problems.