.png)
Worksheet
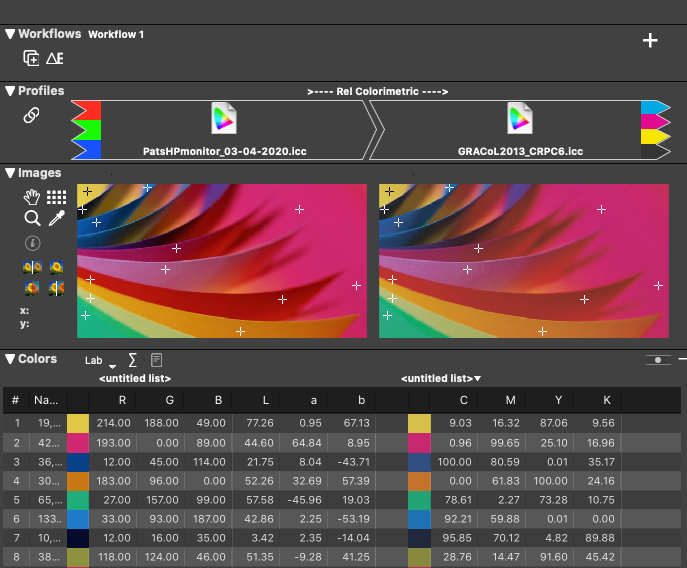
The Color Worksheet is a spreadsheet that understands color. Horizontal sections in the worksheet are for profiles, images, color lists and workflow information. Columns are for color transformations, comparisons and delta-E calculations. The combined effect is a multi-purpose tool with unlimited color evaluation configurations.
Worksheet Concepts
First, a few important concepts and definitions, as far as the Worksheet is concerned:
The Worksheet contains one or more Workflows, each of which contains one or more Transforms.
A Workflow is best understood as the “lifecycle of a color”. It starts with a single source of color such as an image or list of colors. Transforms then convert these colors using ICC Profiles. Multiple profiles can convert color through multiple transforms, each picking up the color from the previous transform and converting it to a new form.
When two color sources are loaded into the Worksheet, each begins its own Workflow. Transforms can be applied to each Workflow as needed.
This allows for a wide variety of scenarios and the ability to do simple comparisons or to model complex workflows.
Activate the delta-E (∆E) function to calculate the color shifts between any two transforms in the sheet.
A few examples include:
Two color measurement lists are opened into the worksheet and delta-E calculates the difference between them. This could be comparing two different paper measurements, an original set of measurements and a set after the sample faded, or was laminated, or a new set is measured to see if an inkjet has color shifted.
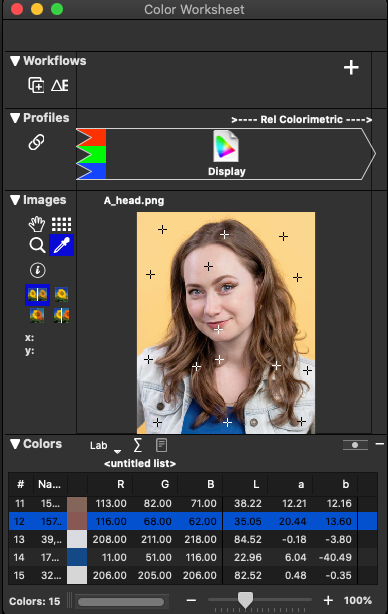
An image is opened into the Worksheet twice and AdobeRGB is assigned to one and a scanner profile to the other. You can see the visual difference in the images and once delta-E is activated, a heatmap of color shifts showing the image parts most affected.
A list of brand colors is opened into the Worksheet and transformed by a press profile and an inkjet profile. Delta-E is activated and each transform is compared with the original colors to see which step in a separation-then-proofing workflow caused some concerning color shifts.
Worksheet Layout
The worksheet is composed of 4 horizontal regions:
Workflows
Shows workflow boundaries, delta-E controls
Profiles
The Profiles region is a graphical representation of profiles and their transforms. Color-accurate tabs show color channels, profile names & icons, rendering intent popup menus and a profile popup menu for changing profiles & setting other parameters. Click the link icon to link profiles into device link, abstract or ColorCast profiles (depending on color spaces and licensing).
Images
The Images region shows 2D images of graphics files or color lists (target layouts). Click the image layout icons to tile them together, singly per transform, sliced for showing the same image detail for each transform or a single image affected by each transform. The dropper tool samples colors from each transform & delta-E calculations. The target selection marquee selects a grid of points from an image and multiple popular target formats are available. Use it to sample target colors from an image & display as a list for further processing. Image details are available including resolution, file size, RAM size, EXIF data, and so forth.
Colors
Shows numeric color values in list form along with a color-accurate sample patch. Click any column heading to sort the list by that column. Color values can be displayed using a variety of units (Lab, LCH, XYZ, Yxy, etc). Device values can include total ink value (TAC), spectral values will default to D50, 2 degree color calculation. Custom illuminants may be loaded in the Color Setup section.
Hint: The W, P, I and C keys will open or close each region
Region popup menus for workflows, profiles, images and lists
Each region has a popup menu (title text or file / profile name with trailing that contains additional functions. See each region’s respective “Working With...” section linked below, for more details.
Each region’s divider contains a disclosure triangle. Click on it to hide / show the contents of the region or hit the W, P, I and C keys to open or close each region.
When both the Image and Colors regions are visible, drag the divider between them ![]() to resize each region without changing the size of the window.
to resize each region without changing the size of the window.
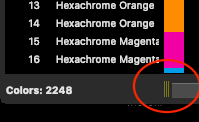
The zoom slider in the bottom right corner of the Colors region changes the size of the color list elements.
 Drag the Colors region handle to changing the width of the “name” column of any color list.