.png)
Color Lists in the Grapher
A color list can be a file that contains color information such as measurement data files, synthetic test data, a list from the Colors tab of the Color Worksheet, or even image files. A color list can be displayed on the grapher as points or as vectors.
The Grapher will only graph color lists that contain Lab values or spectral values. It will not graph color lists containing only RGB values or CMYK values. The reason for this is that RGB or CMYK numbers represent device values which do not by themselves define a specific color. (they only define how a color is produced on a certain machine)
To graph a color list made up of device values, try the following:
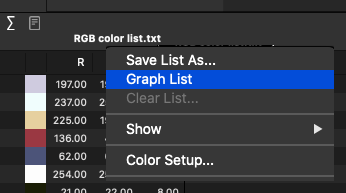
Open the RGB or CMYK color list into the worksheet and choose Graph List.
The software will automatically apply sRGB to your device values (unless you specify a different profile), and graph the color list accordingly.
Bring the RGB or CMYK color list into the Grapher, choose "Plot as Vectors," apply a profile to the "Destination" space, and the colors will be graphed according to how they are defined by the profile.
Choose a different option when creating the color list in the first place.
Many apps, such as i1Profiler or ColorAnt, offer several different choices for saving or exporting color lists. Choose one which includes Lab or spectral measurements.
An example of a Color List
ColorThink recognizes color lists that correspond to the CGATS format as well as several other common industry formats, including .cxf and some other .xml formats.
Plot as Points
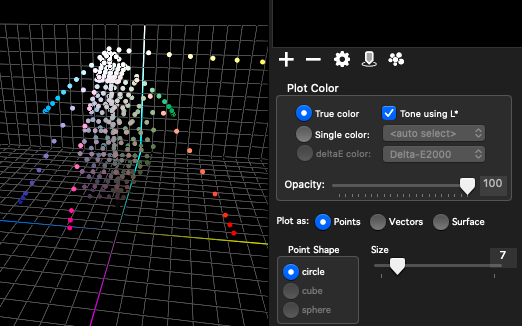
Point shapes can be either squares, cubes or spheres.
Use the Size slider to change the size of each color point plotted.
Join With Lines
This feature will attempt to connect adjacent points with lines.
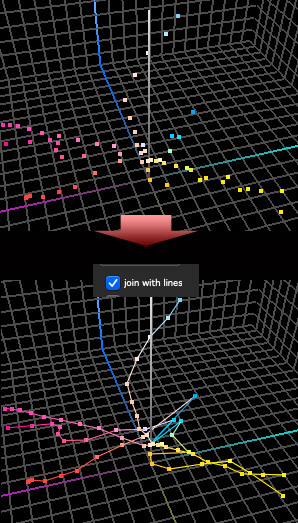
The primary intent of Join with Lines is to help those analyzing their primary and secondary colors by making it easier to see which colors belong in which group, especially when looking at very irregular profiles.

The Evaluate Device Linearity procedure in the ColorSmarts Guide is an example of how this is used to great effect.
ColorThink makes this feature available to all points in case the user finds it useful.
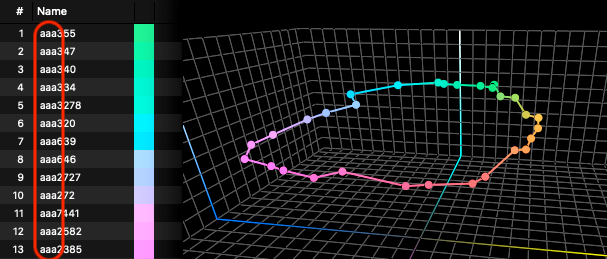
What determines how lines are drawn
The Grapher looks at the first three characters in the name of each color in the colorlist. If the first three characters are the same as the previous color, Grapher will draw a line between them. If they differ, then no line is drawn.
Plot As Vectors
Plotting colors as vectors creates a graphical view of color shifts in 2 or 3 dimensions. This technique quickly reveals how color shifts occur in different color areas of the 3D color space, including lightening/darkening, hue shifts, and saturation changes.
Vectors can be used to:
Compare two sets of measurement files showing:
- Color shifts as inks dry
- Differences between papers
- Differences between ink sets
- Differences between printers
Compare two sets of image data showing color shifts after applying profiles or performing color edits.
Show color shifts as profiles are applied to either color lists or image data.
The vectors will look like little tadpoles. Think of it as the first list is the "before" and the second list the "after". The dot will appear at the end of the vector and represent the color that is second in the list of plot items.
This feature can be very useful for viewing device drifts, how different printer/ink/media settings affect color, or how different filters on a measuring device affects the color values.
Enabling Vectors
Select an Image or Color List plot item and click the “Vectors” button.
A “Destination” box will appear.
Drag the comparison data or a profile into the Destination box.
Comparison data would consist of another color list. It is suggested the original color list and the destination color list have the same number of colors. If the number of colors in each list differs, ColorThink will plot all the vectors for which a color exists in each list. Additional colors in the longer list will be ignored.
When a profile is placed in the destination box, ColorThink will apply the profile to the colors (for a device profile, it “round trips” the color list) and show the color shift that occurs as a result of this conversion. This round trip consists of a conversion from Lab to the color space of the device profile and then a conversion back to Lab using the same profile. Assuming the “back” or “proofing” conversion of the profile is accurate, this round trip transform will show how much color shift occurs as a result of the profile application. Out-of-gamut colors will be shown shifting into gamut to become printable. In-gamut colors will shift due to perceptual renderings or profile errors.
Device profiles convert from device values(RGB, CMYK, etc) to color values(Lab, YxY, etc) and vice versa. A conversion from color to device values isn’t graphable as the Grapher only graphs color. Applying the device profile a second time, to convert the device numbers back to colors is quite useful and often called Round Tripping the color.
A common example is converting some brand colors from their Lab values into CMYK for printing. The CMYK is useful for sending to a press but we won’t know what colors will result until it’s printed. The profile’s “proofing transform” can convert the CMYK values back to Lab to simulate what the resulting colors will be. Then we can compare the initial and final Lab values to calculate error (delta-E) or visualize the error as vectors in the Grapher.
Proofing colors is the process of simulating how color will appear on one device, like a press, using a second device, like an inkjet printer or monitor. The color shifts and different gamut of a slower, more expensive device, can be quickly and accurately shown on a faster, less expensive one - or even free, in the case of your monitor. The round trip from Lab->CMYK->Lab can capture the conversion and proof in one step. This proof simulation can then be embedded into another ICC profile using ColorThink’s ColorCast function. See "Create ColorCast Profile” in the ColorSmarts Guide for more information
An illustration of using vectors to compare two different measurements is presented in the Compare Device Measurements section of the ColorSmarts Guide.
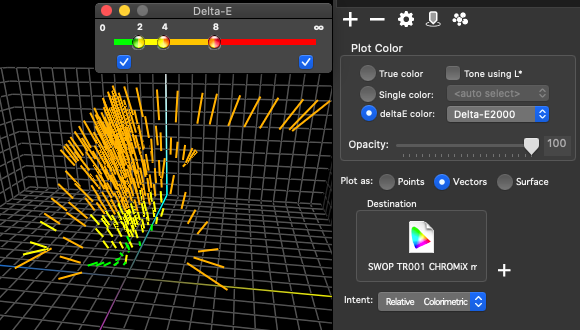
Rendering Intent (profiles only)
To change the rendering intent used for the conversion (the Lab->device part of the conversion):
Select the rendering intent from the “Intent” popup menu. ColorThink will recalculate the color shifts using the new intent.
Coloring by delta-E - see delta-E color in Plot Item Control above.
Reveal Embedded Measurement Data
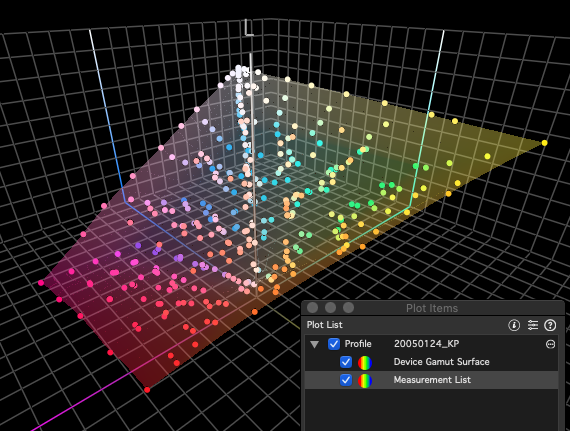
If the profile in the Grapher includes the measurement data used to create the profile, ColorThink will make this measurement data available in a subheading under the profile name. Turn the profile display on and off & show the measurement data to confirm if the profile shape conforms to the shape of the measurement. This is an effective way to double-check a profile’s validity and calculations.
Multiple Sub Plot Options New in 4 
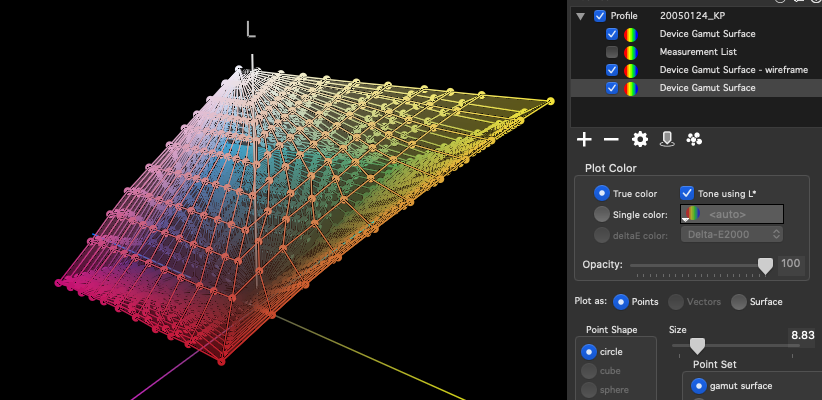
Highlighting grid points in the Grapher
The gear menu has options for display multiple gamuts of the same profile. This can be used to demonstrate or highlight specific attributes in a variety of visual ways.
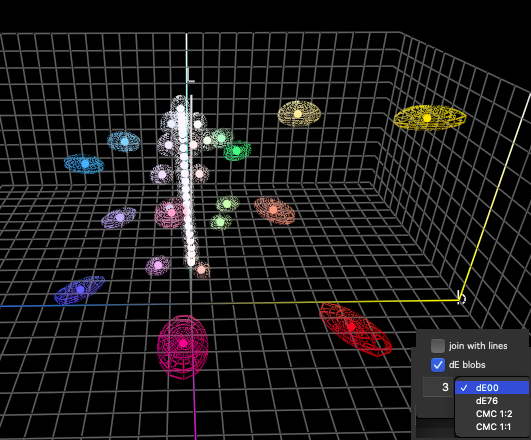
Delta-E Blobs New in 4 Pro Feature
dE Blobs visualizes Delta-E color error as a space surrounding points in a color list in 3D space.
Technically called Differencing Ellipsoids, these spheres or globes show the delta-E distance surrounding a point to demonstrate how close or far the point is from other 3D elements/locations. In other words, all the colors within a certain delta-E value of a reference color will fit inside its surrounding blob. For lack of a better term, we refer to them as Delta-E Blobs, though we’re continually on the lookout for a better name that also fits in the Grapher’s interface!
Background info: The common expectation that CIEL*a*b* space is perceptually uniform, is not exactly true in the case of Lab space, and varies considerably depending on which 3D space is being used. When the delta-E 2000 equations attempt to compensate for Lab’s warped space, it’s clearly seen in the elongation of these delta E blobs, especially for areas farthest from the central neutral axis.
The size of the blobs is adjusted to the ∆E tolerances entered into the dE field. The default is 3 ∆E (dE2000).
For example, if a printer is out of tolerance when comparing a measurement to their color aim, it is helpful to know if the delta E tolerance is affected by this Lab warping.
It is also helpful to observe which alternative 3D color spaces more evenly represent distances between colors (and have more rounded/spherical blobs). The possibility of alternate color spaces to Lab is a more recent innovation in the color world. We will endeavor to make new color spaces accessible in ColorThink when they become available.