.png)
ColorSmarts Guide
The ColorSmarts Guide in ColorThink simplifies complex color tests and analyses by automating multi-step processes. It offers two main ways to select tests: by function for specific analyses and by tool for learning about each tool’s functions. The Guide also provides detailed descriptions of each step, enabling you to learn and customize the settings as needed.
The ColorSmarts Guide is part automator, part tutor. Many functions in ColorThink require multiple steps performed in the correct order to obtain the correct results. The Guide can help automate these tasks, simplifying a multi-step color test or analysis to a few simple selections.
The Guide also describes each step in the process so you can learn how to perform them yourself and alter the settings as you need.
Open the Guide by clicking on the Beanie icon on the far right of the tool bar.

Selecting Tests
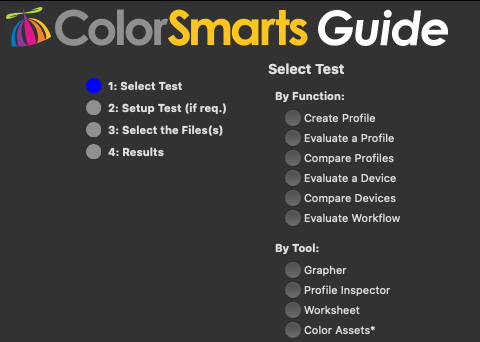
Select the Guide’s test by Function or by ColorThink Tool. Use the function grouping when performing particular analyzes and the tool grouping when you want to learn more about each ColorThink tool's function.
If you are just learning about ColorThink, viewing some of the tests By Tool is a great way to learn more about how each of the tools work. In this way the Guide is almost like a tutorial, showing you many different ways each tool can be used.
Color-managed workflows are composed of profiles, measurements, images and so forth. ColorThink allows the analysis of each of these workflow components as well as the evaluation of the entire workflow. By isolating each component in your workflow you can determine the function it performs as well as which item might be contributing to color errors.
Profiles
Profiles contain a significant amount of information about the devices they represent and about their output functions.
Create a Profile
While ColorThink doesn't create the more common ICC device profiles, it does generate device link, abstract and ColorCast™ profiles. These Guides help setup each of these profile types. See ColorThink Pro - Seven Profile Types for more information about each profile type.
Example: Creating a "ColorCast" profile:
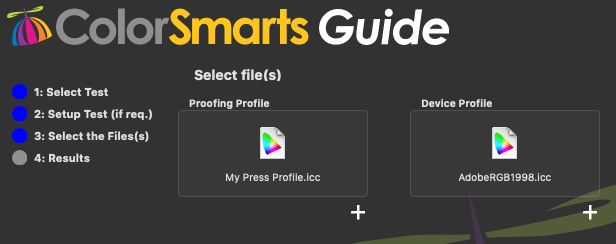
When creating a ColorCast profile, the select file pane comes up.
In the Proofing Profile area, insert the profile you want to proof - that is, the profile that has the effect you want to have simulated.
In the Device Profile area, insert the profile that gets the simulation inserted into it, the profile that you want to end up with.
For example:
You would like to have the effect of a CMYK printer profile bound into an RGB profile. The CMYK profile would be the Proofing Profile and AdobeRGB would be the Device Profile.
See the section on the Color Worksheet (Part 1) for more details on how ColorCast, Device Link and Abstract profiles are made.
Open the topics below for more details on Abstract and Device Link creation Guides:
Create a Profile - Abstract
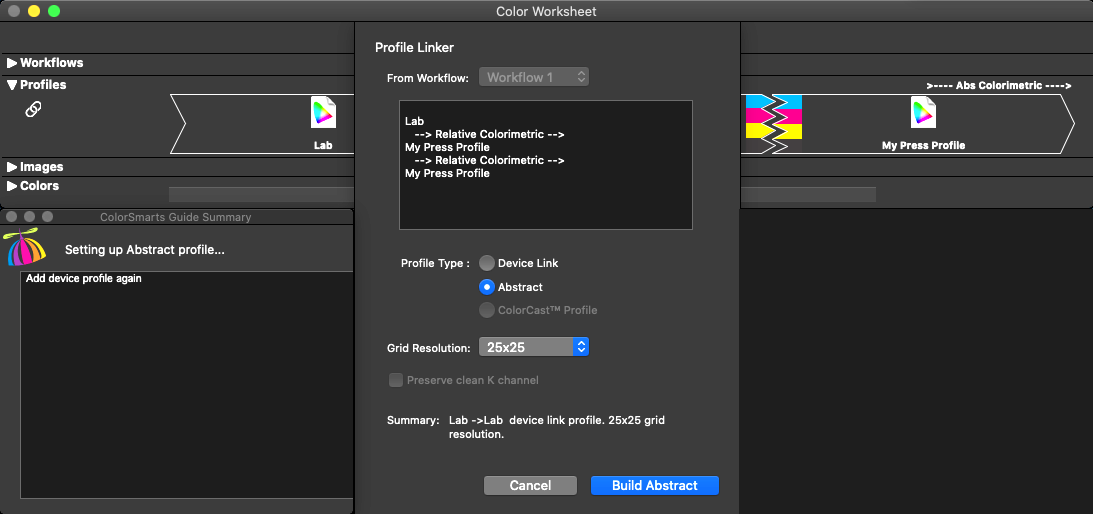
Binds two or more profiles together into an Abstract profile. Useful for capturing color transformations in a Lab->Lab form.
Note: Photoshop CS4 can handle converting images to abstract profiles.
An abstract profile begins in Lab and ends in Lab, so the Guide opens the worksheet in Lab space, applies the profile you specify, and then applies the profile again to "round trip" the profile back to Lab again. You have the option to specify what grid resolution you wish this profile to have and what name you wish to call it.
Create a Profile - Device Link
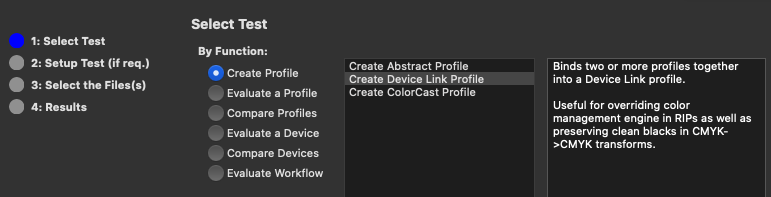
This feature automatically binds two profiles together into a Device Link profile. This is useful for overriding the color management engine in a RIP, or for creating as well as preserving clean blacks in CMYK->CMYK transforms.
Choose Create Profile
Choose Create Device Link Profile
Click and drag your source and destination profiles into the source and destination boxes
You have a choice between grid resolutions and whether or not to preserve the K channel in the transform.
Evaluating and Comparing Profiles
Device profiles contain both the ability to output to the device as well as the ability to simulate the device on something else (soft and hard proofing). Use these tests to isolate each function in profiles as well as compare two profiles.
Remember, gamut graphs represent the gamuts of devices described by profiles. If you are looking for the comparison of two profile gamuts, you are actually comparing the gamuts of two devices - see Evaluating and Comparing Devices below.
Evaluate Profile Proofing
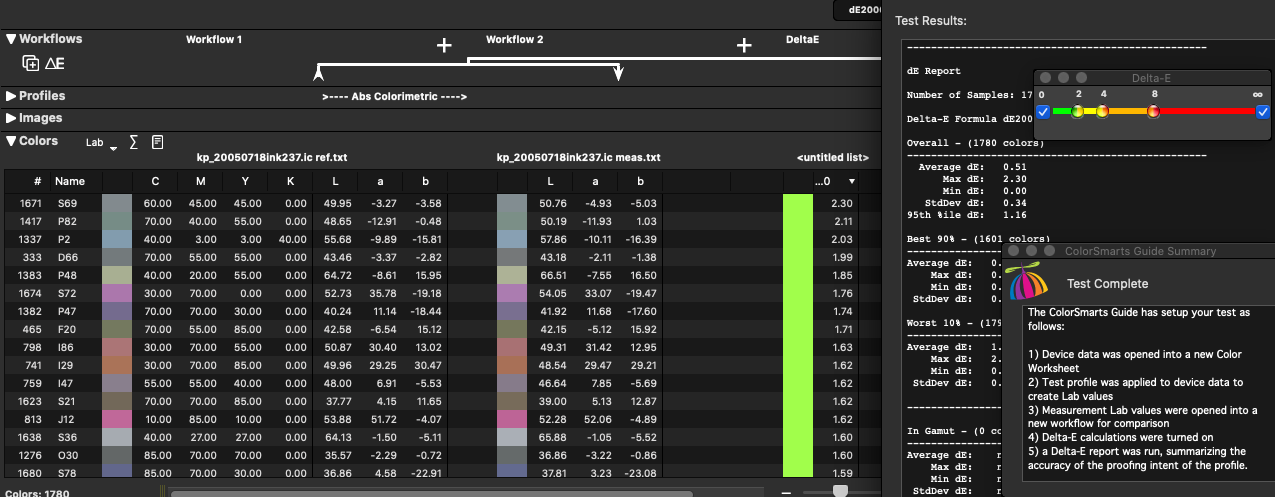
This procedure helps evaluate the proofing capabilities of one profile. This will determines the accuracy of the device->PCS (eg. CMYK->Lab) "proofing" capabilities of a profile.
This test helps you see how accurate a profile will be when it provides you with a "soft-proof" in programs like Photoshop.
Select your profile. (If your profile has embedded measurement and reference data, like GretagMacbeth profiles for example, the Measurement data and reference data fields will be populated automatically. Otherwise, you will need to find these files and drag them into these fields.)
With this test, you have a choice of whether you want the results in the form of a 3D graphical representation, or having the numbers laid out in the worksheet.
When the worksheet option of this test is complete, the Feedback window summarizes the delta E values that show how far off the proofing portion of your profile is. (The smaller the number, the more accurate your profile can proof.)
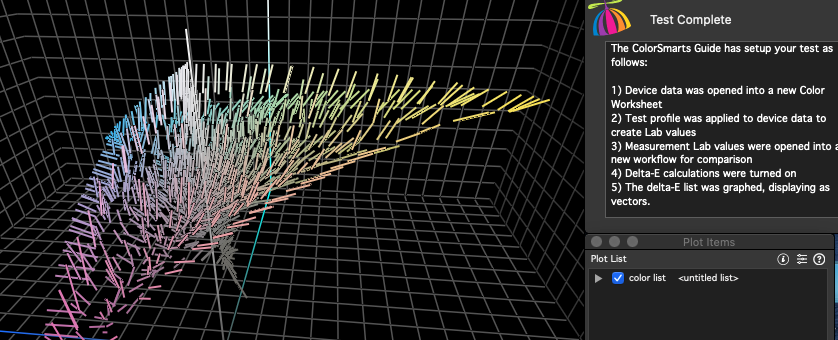
If you've chosen the graph option, the measurement color list is displayed in the grapher, showing the movement from reference colors (the colors that would be expected by being run through the profile) to actual, measured colors. The longer the vector arrows are, the greater is the change in the proofing direction of the profile, and so the less accurately the profile will proof.
Evaluate Neutral Rendering
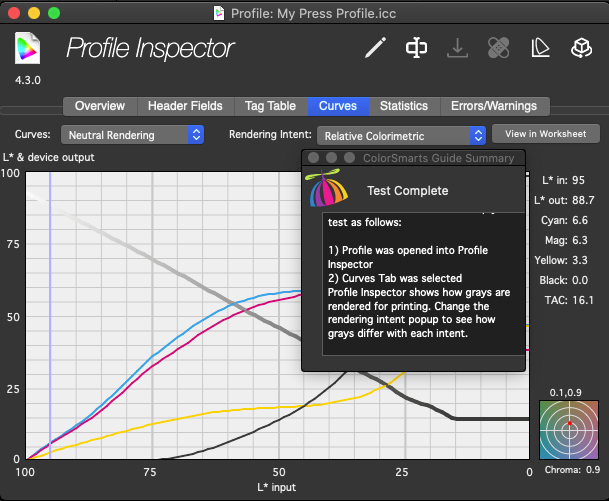
This evaluates the ability of a profile to render grays accurately. This also shows the components of each colorant used to create grays.
For more information see the Profile Inspector - Neutral Rendering Curves
Compare Input Profiles
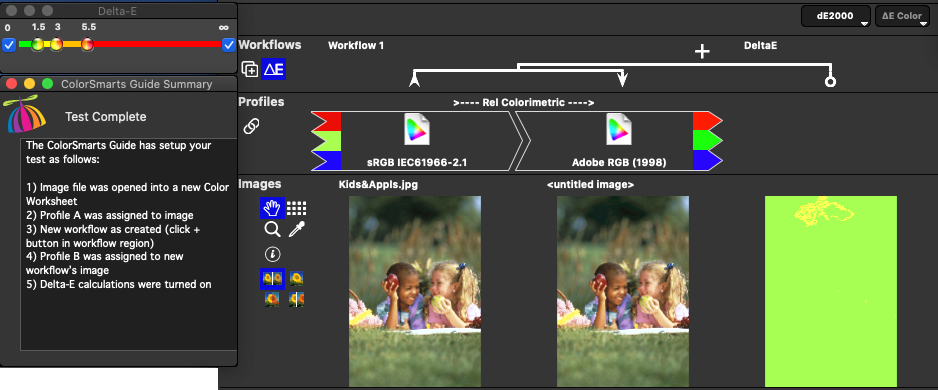
Compare the color of two or three input profiles. Using an image, input profiles are compared visually as well as numerically.
This is a visual comparison between profiles. Here ColorThink will use the Images section of the worksheet to see how different input proflies will affect the color of an image. Also, a delta E calculation is turned on so you can see exactly where in the image color differences occur and approximately how far off the colors are.
This guide was originally created to test different camera profiles, to see which profile looks best, using the same image. This can also be used to test scanner profiles. Do you want to see what the different settings in your Camera Profiling module will do when making profiles? This is the tool to use to test them.
Compare Profile Structures
Compare the file structure of two profiles. Determines the differences in profile headings, tag table and tag contents.
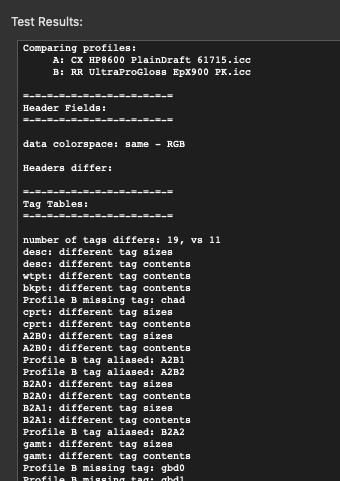
This report compares the file structure between two profiles. With this test you can quickly gather in one report all the differences in the tag tables, header information, etc
Possible uses:
Determine if one profile has been edited, by comparing it to the original.
Verify that a profile editor has actually produced the changes expected.
When ColorSync has "fixed" a profile, see where the changes were made.
Devices
Evaluate devices using either measurements of device output, profiles for devices, or both.
Evaluating and Comparing Devices

Use these tests for a wide variety of tasks including calculating gamut volumes, comparing gamut graphs, checking device calibration and more. Select each guide for a description of its function.
Evaluate Device Dot Gain (TVI)
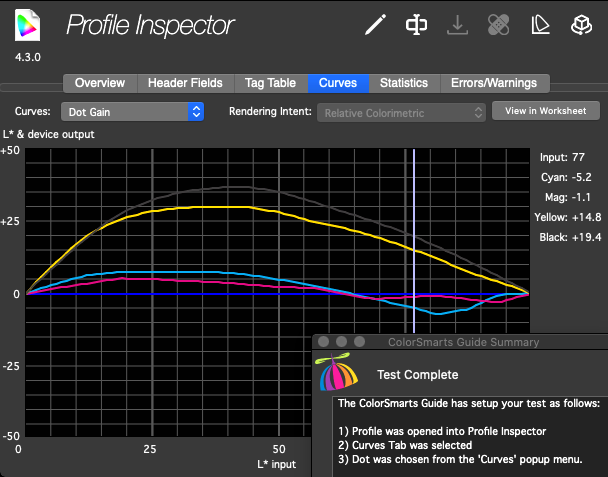
Estimates the dot gain of the profiled device at the time of profiling. Dot gain estimation is calculated from the device profile.
Note: Evaluate Device Dot Gain will only work properly with a CMYK device profile.
ColorThink will even evaluate dot gain from profiles that do not include measurement data.
See Dot Gain Curves for more information on the dot gain calculation in ColorThink.
Evaluate Optimal Device Ink Limits
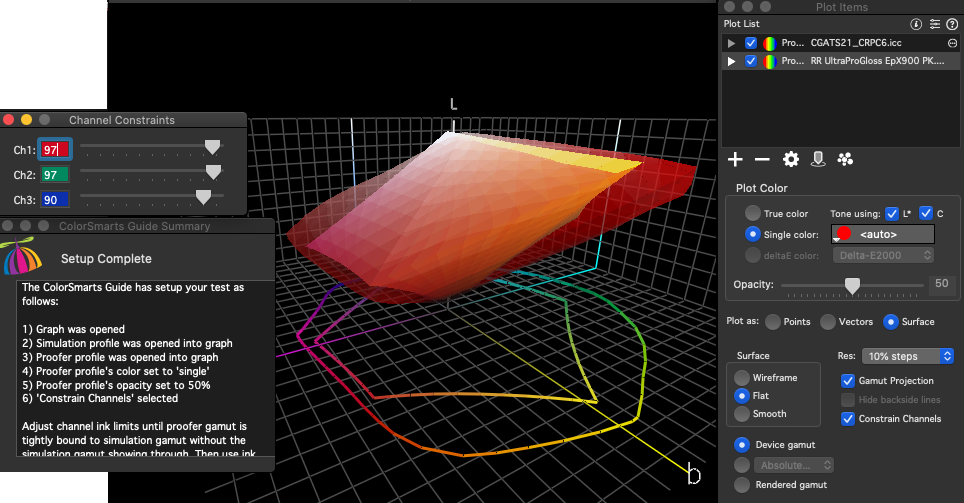
Compare the gamut of a proofing system to a simulation profile to determine the best ink limits for the proofer.
Good for setting inkjet channel limits prior to profile generation.
Limiting inking levels improves profile accuracy. This test ensures that you don't limit too much - for example, shrinking the gamut so it cannot contain the simulation profile.
This test opens the two profiles into the grapher and activates the Channel Constraints feature. Set the Channel Constraints sliders to reduce the ink used in the proofing profile. When the gamut of the proofing profile is reduce until it just contains the simulation profile, make a note of the channel constraints numbers and apply those to the RIP. See the ColorSmarts Guide Summary window (which shows up at the end of the test) for further instructions.
Also see the Constrain Channels feature of the manual for more information.
Primarily, this test is intended for press operators who need to know the best ink limit for their proofing printer. Many printers used for creating hard proofs are inkjets which have a wide gamut compared to the presses they are intended to proof. Since this extra gamut is not necessary, limiting the ink going to the proofer can help save money on ink as well as make proofs more stable, color-wise.
While this is primarily intended for CMYK profiles, the constrain channels feature is also available for RGB profiles, to help learn or demonstrate how red, green and blue contribute to the shape and makeup of the profile.
Evaluate Device Linearity
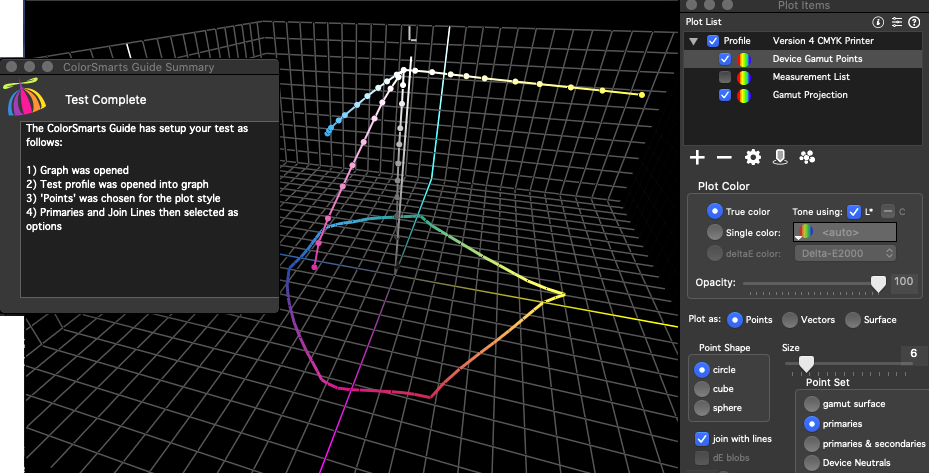
Determines the linearity of a device (smoothness of transitions between tones in each channel). Calculates linearity from an existing device profile.
A profile is opened up in the Grapher, and plotted as points, with the points limited to a narrow field of primary colors. The straightness of the lines, and the distance between points provide an instant, visual indicator of how linear the profile is and how much hue shift occurs as the ink levels increase (the Mass Tone Effect). It’s worth noting that curves in the blue region are probably due to the curvature of Lab in the blues - this is what lead us to adding alternate color spaces like Jab and OKLab.
This information can be used to suggest per-channel ink limits for CMYK and other print profiles.
This can be used for RGB, CMYK and other print profiles (depending on licensing).
Don't forget to uncheck "Tone using L*" to see the darker points more clearly. Choosing primaries & secondaries will add the secondary colors to this 'spider graph' and you can view the results of combinations of colors.
Evaluate Device RGB Calibration
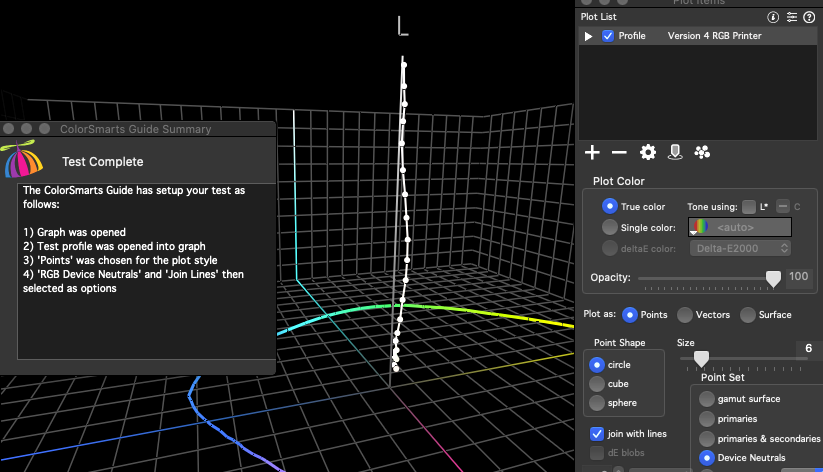
Evaluate the neutral calibration of an RGB device. RGB devices that can be calibrated typically set equal RGB values to gray (eg RGB (100,100,100) -> Lab (45,0,0).
The calibration state at the time of profiling can be calculated from the device's profile.
With a well-calibrated system, you would expect to see the vertical line of neutral points stay very close to the neutral axis in the grapher.
An example for the use of this test would be to verify the calibration of a Fuji Frontier or a Noritsu digital minilab before profiling targets were run. These are examples of RGB printers that (are supposed to) go through a calibration procedure on a daily basis to bring the printer back to a known state. This test will show how accurate the calibration was at the time of profiling. Think of this as a "peek around" the profile to see how the system's doing.
Evaluate Device Tone Stability
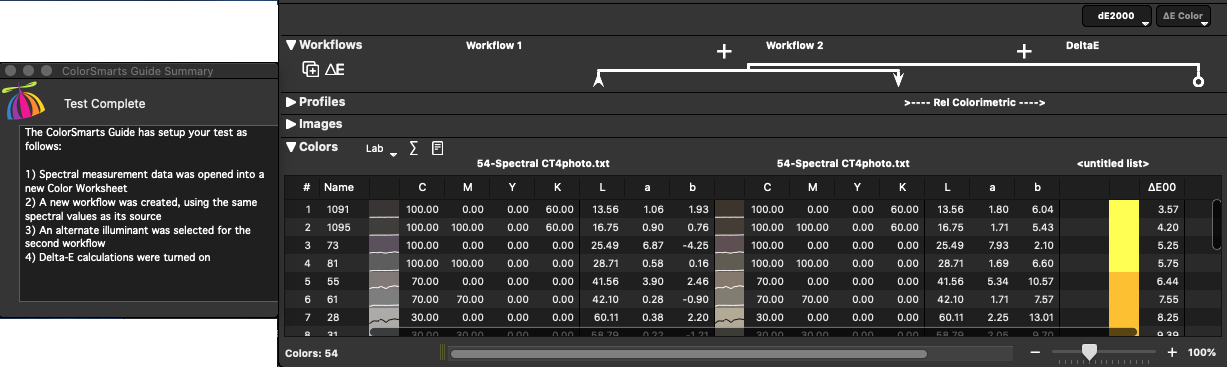
Applies two different light sources (illuminants) to a spectral measurement file and determines the amount of color shift that occurs.
Use this test to see what will happen if you view a measurement file under different light sources.
This test requires a measurement file that contains spectral measurements.
The measurement is opened in the worksheet twice using different illuminants. The Lab values are calculated using D50(daylight) - and D65. The difference between them (in delta E) is calculated and shown.
Note: From this point, you can change the illuminant for either of these workflows by:
clicking on the list title,
choosing "Color Setup," and
choosing a new item under "illuminant"
This procedure can be used to
Compare D50 with your own environment's ambient light
Compare daylight with a particular gallery's lighting
Compare different light boxes
Compare any two real-world light sources
See more information at Color Setup.
Compare Device Gamuts
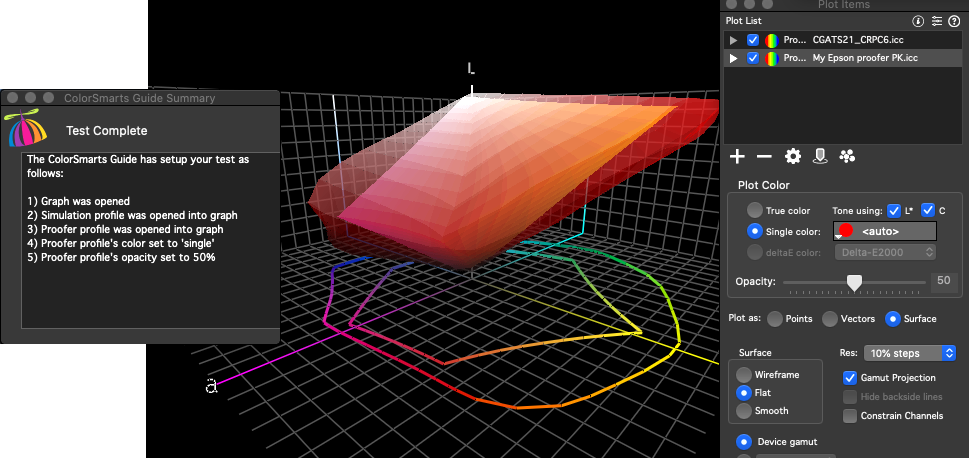
Compare the gamuts of two devices. Good for determining if a proofer can reproduce the gamut of the device it is supposed to simulate.
Enter a simulation profile (ie: GRACoL 2013 CRPC-6) and the output profile for your proofing printer (ie: MyEpson9880.icc).
The simulation profile is graphed as a solid gamut, while the proofer is graphed so that it is semi-opaque.
Inspect the gamuts to ensure that your proofer fully engulfs the simulation profile.
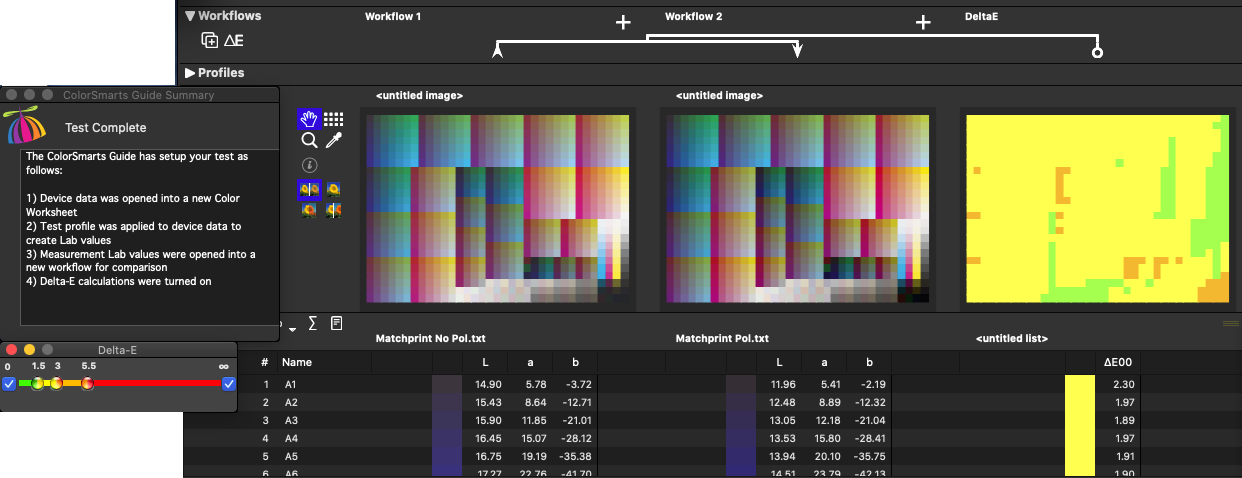
Compare Device Measurements
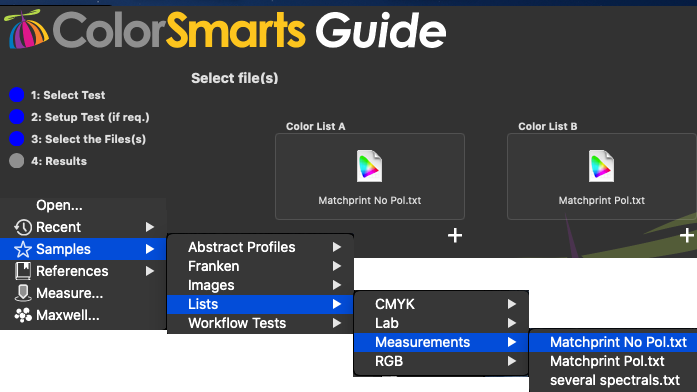
Compare two color lists using delta-E calculations. Good for comparing any two sets of measurements for two devices, ink fading, paper differences and so forth.
The two measurements should be formatted the same.
To demonstrate this test, use the "Matchprint Pol" and the "Matchprint No Pol" color lists that are included in the built-in demonstration files here:
Samples > Lists > Measurements > Stunt Files
This will compare the effect of a polarizing filter in measuring a Matchprint target.
The same patches from the two measurements are listed together. The delta E column header can be clicked to order all the patches according to dE amount.
In this example, we can see that the polarizing filter caused darker patches to have a lower Lab value. Click on the Images tab to open up an image of the original target, showing the location of the patches with the highest delta E.
Choosing the graphing option (instead of "worksheet") will allow the change between color lists to be displayed in the 3D grapher.
Workflow
Sometimes the only way to understand the results you are seeing is to model the entire workflow in ColorThink. The Color Worksheet offers many different methods for setting up a workflow simulation. To get started with a simplified workflow, have the Guide set one up for you and then try your own.
Evaluate Workflow
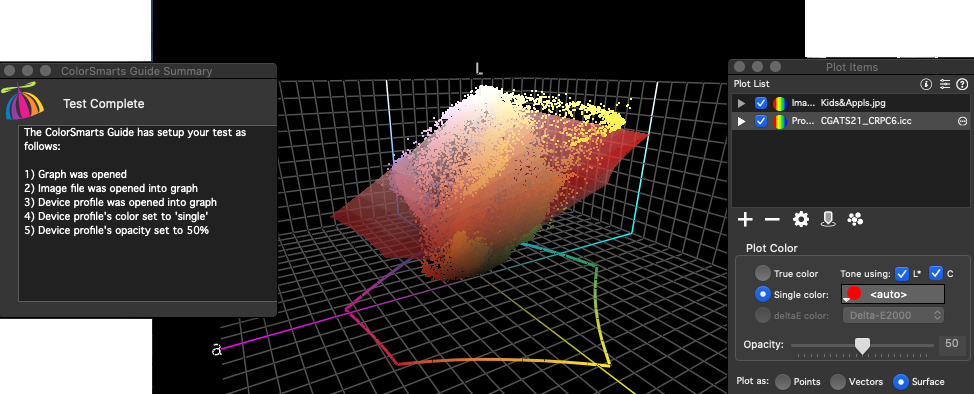
See how image colors compare to a device gamut. Determine which colors are out of gamut and will shift when converted.
The Guide sets up a simple workflow in the grapher.
An image is brought into the grapher where all the pixels are displayed in a 3D color space
A device profile is displayed in the grapher in a "see-though" state
The pixels that are out-of-gamut for the printer are clearly displayed out of the profile gamut. These colors can be expected to shift when printed.
Supplying Files
After selecting the desired test, the second step is typically to supply the files (profiles, measurements, etc) to be analyzed. The Guide provides 'drop zones' for each of the test's required files. Either choose the '+' menu to open files or drag and drop the files from the Finder or Windows Explorer.
Profile training data is extracted automatically
Many profiling tools embed the original measurements and reference data in their profiles. The ColorSmarts Guide automatically extracts this data when needed for tests (Evaluate Profile's Proofing Accuracy, for instance). To determine if your profile's data is in a recognizable form, open it into the ProfileInspector and select the "Statistics" tab. If Training Data Available is marked "yes" then the Guide should be able to automatically extract this information for testing (the Grapher will also be able to extract it for easy comparison in a graph)
Choosing tool for display of results
ColorThink's tools are based on a shared underlying structure that allow the same color information to be shared by the Grapher, the Color Worksheet and so forth. This allows many of the Guide's test results to be produced in your choice of ColorThink's tools.
For the final stage of running a test, choose your desired tool from the list of enabled tools. The Guide will disable any tool choices that are not available for each particular test. This same mechanism is used by the Guide when selecting tests by tool.
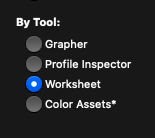
The possible ColorThink tools used for a test include:
Grapher
Profile Inspector
Worksheet
Color Assets
Running the Test
While the test is running, the Guide moves into a small floating window and displays a text description of each stage of the test. When the test is complete, each step is listed to aid in reproducing the results 'by hand'.
Re-Running tests
Click on the Beanie icon to reopen the Guide window and perform additional tests.
Suggesting new tests
If you find you are performing the same multi-step tests in ColorThink over and over, send us an email or a feedback item using ColorThink's built-in feedback system (ColorThink/Window > Feedback System…) Describe the steps you perform and how you interpret the results (the practical use of the test) and we may add it to a future version of the Guide.
Keyboard Shortcuts
When configuring tests in the Guide the left and right arrow keys will move you backward and forward.
Also, double-click on a test name to select the test and move to the next step.