.png)
Curves
The Curves tab gives a 2D graph of the either the neutral rendering curves or (if you have the Pro license), TVI / dot gain curves.
Neutral Rendering Curves
The Curves indicate how the profile balances ink, all along the levels between white and black, in order to render / produce neutral gray.
CMYK & Subtractive Ink Profiles
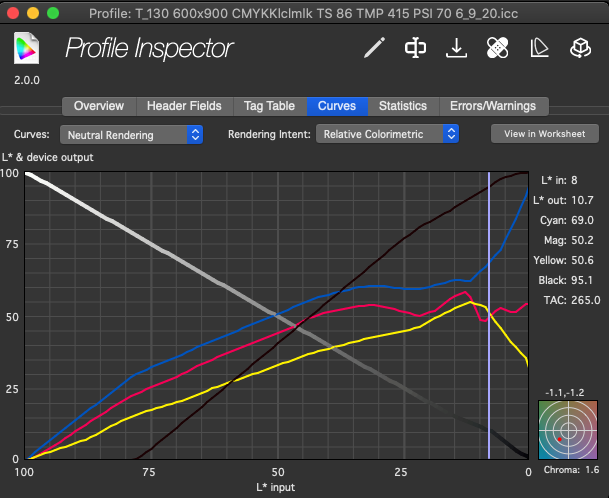
When viewing a CMYK or other ink-based profile, a thin colored line for each ink is shown running from bottom left to top right. They represent the amount of ink the profile will output in each channel when creating neutral grays.
The bottom (X) axis, labeled 100 to 0, (left to right) represents the lightness (L*) input values.
The left (Y) axis, labeled 0 to 100, (bottom to top) represents the ink output values and the L* output values (the lightness level that’s expected when the input L* value is requested).
The grayscale graph line running from the upper left to the lower right is the entire range of output lightnesses. You’ll find it limited on the left/top by the maximum lightness of the paper and on the bottom/right by the maximum density (minimum lightness) achievable on the paper with the inking levels. (more below in Gray Line)
Change the rendering intent that is graphed by clicking the drop-down box next to "Rendering Intent."
RGB
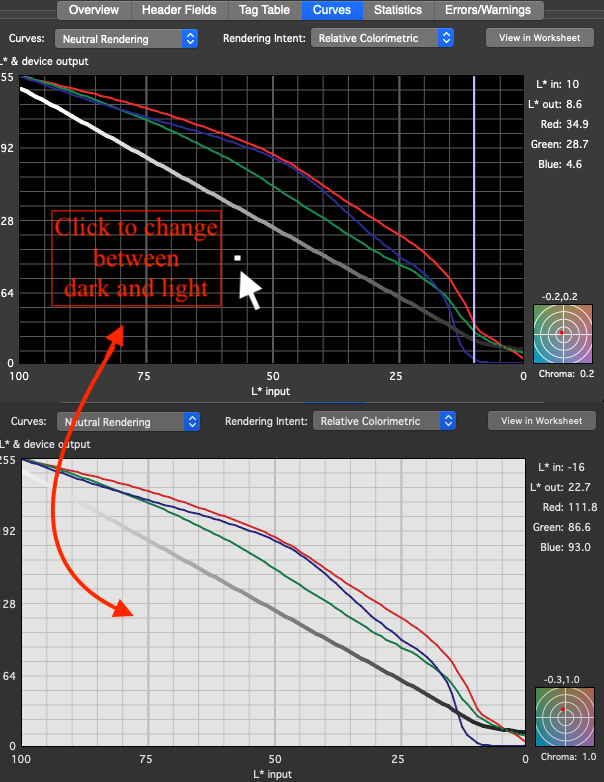
Since an RGB profile represents additive primary colors, the Curves tab will represent three thin lines of Red, Green and Blue running from upper left to bottom right. In other words, the upper left corner will start out white, with all of the RGB values combining to make black at the bottom right.
New! The background behind the colored ramps can be changed from black to white merely by clicking anywhere in the graph.
Gray line (any profile type)
The thick gray line running from top left to bottom right represents the gray level reproduced by the profile. This line is color-accurate, so if the profile produces off-color neutrals, they will be reflected in this gray line.
For RGB profiles the number scale on the left of the graph indicates RGB values from 0 to 255. The L* values for the Gray line are still between 0 and 100 but they’re left off the graph for space.
So, at the upper left starting point is the paper’s white point (or off-white point). The line represents how much lightness is presented in relation to how much ink of any color is being laid down.
Chroma Graph
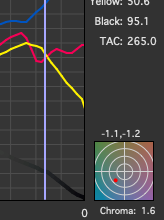
The Chroma graph identifies at what point (in Lab space) is the neutral axis of the profile, for any given L* (lightness) value. It is as if you were looking down the center of the profile and seeing where the grays differ from the center of Lab. The numbers on top of the Chroma bullseye graph are the a* and b* values corresponding to the L* values in the gray line (above). The Chroma value below the graph tells how many Chroma values away from Lab neutral that point is. The concentric rings in the Chroma window are one delta E apart.
The Chroma graph identifies at what point (in Lab space) is the neutral axis of the profile, for any given L* (lightness) value. It is as if you were looking down the center of the profile and seeing where the grays differ from the center of Lab. The numbers on top of the Chroma bullseye graph are the a* and b* values corresponding to the L* values in the gray line (above). The Chroma value below the graph tells how many Chroma values away from Lab neutral that point is. The concentric rings in the Chroma window are one delta E apart.
So, in this illustration: at an L* value of 8, the a* value would be -1.1 and the b* value would be -1.2. This is a slightly cyan point approximately 1.6 deltaE76 away from neutral.
This window is not necessarily an indication of how accurate your profile is, but is a good gauge of how much work your profile is doing to get your color into shape - and how successful it is.
TVI (Dot Gain) Curves
Pro Feature 
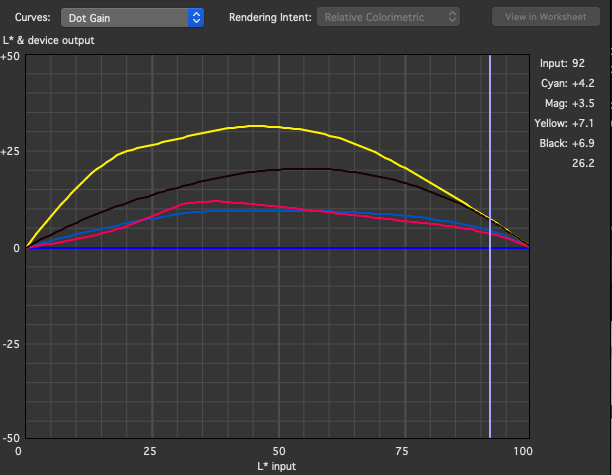
These TVI (Tone Value Increase, or dot gain) curves are calculated using the XYZ method of dot gain calculation. To see an explanation of this calculation, check the Bruce Lindbloom website:
One of the advantages of this method is that it allows ColorThink to calculate dot gains from profiles even when there is no spectral measurement data available (for example, when the measurement data is not embedded in the profile.) Other means of calculating dot gain depend on using original spectral measurement data.
Calculation of dot gain is only relevant to CMYK profiles. The dot gain option is not available for RGB profiles.
The XYZ method of dot gain calculation is only applicable to cyan, magenta, yellow and black inks, and may not give accurate results for multicolor profiles using other inks.

Try out the "Evaluate Device Dot Gain" procedure in the ColorSmarts Guide to see this function in practice.