.png)
Profile Inspector
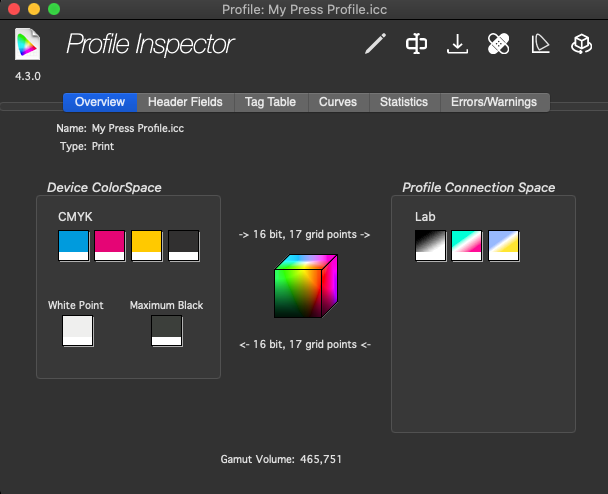
The Profile Inspector opens all ICC-compliant profiles and displays their contents graphically as well as allowing browsing of header and tag table information.
To open profiles into the Profile Inspector do any of the following:
Choose “FileOpen” and select a profile
Double click a profile in Color Assets
Double click a profile plot item in Grapher
Drag a profile onto the menu bar
Drag and drop it onto the ColorThink application icon.
ICC.2 (version 5, also known as ICCmax) profiles are partially supported in ColorThink 4. Their overall structure is the same as ICC.1 (version2 and 4) profiles so ColorThink will open and display their tag list but no colorimetric information is calculated (ink channel icons, curves, general statistics), no error checking is performed and no gamut volume is calculated. We’re continually evaluating ICCmax profile support opportunities and considering them for future versions of ColorThink. If you have ideas or needs, let us know!
Header Bar
The profile icon is draggable and can be added to graphs or the worksheet just by dragging and dropping.
The profile specification version is shown immediately beneath the profile icon, in case you’re worrying about version 2 vs version 4 profile issues.
The icon buttons in the upper right corner all act on the profile at hand and include: white point editing (for relevant profile types and licensing levels), renaming, installing, repairing and graphing in 2D or 3D.
Quick Access Buttons
These icons provide a quick way to perform many useful tasks.
Edit white point
This button will instantly open up the White point tag in the Tag Table to make it available for editing (for relevant profile types and licensing levels).
Rename Profile
Click to open the Profile Renamer
Install Profile
Click to install the profile into your system’s user-level profile location, allowing your various software applications (and the OS itself) to make it available for your use.
Repair Profile
Click to open your profile into the Profile Medic, summarizing the issues found and suggesting choices for repairing it.
Graph Profile (2D or 3D)
Click to add the profile to the Grapher (and switch it to the 2D or 3D view selected)
For more about the Profile Inspector’s tabbed sections: