.png)
What's the difference? delta E
Delta-E is the difference between two colors.
Displaying the delta-E column
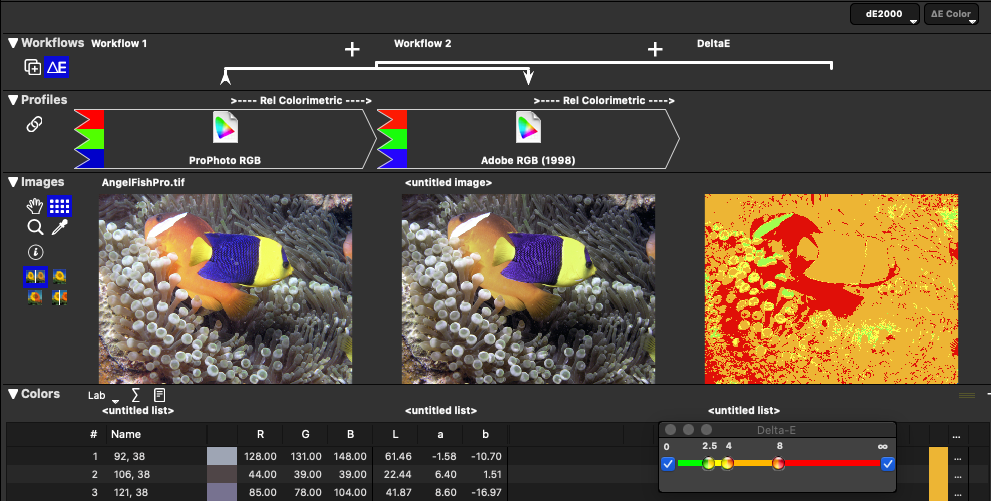
To display the delta-E column and calculate color differences, click the ∆E button in the Workflow region. ColorThink will add a column to the right edge of the worksheet and calculate the appropriate color differences.
Selecting delta-E formulae
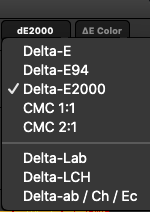
When the delta-E column is displayed, the delta-E Units and delta-E Coloring popup menus are also available. ColorThink allows the selection of several different delta-E formulae depending on your preference. Selecting a new formula will cause an immediate recalculation of all values.
The color differencing formulae available in ColorThink Pro are:
delta-E 1976
delta-E 94
delta-E 2000
CMC 1:1
CMC 1:2
delta-Lab
delta-LCH
delta ab / Ch / Ec
Note: Altering the delta-E formula will not affect the length or distribution of vectors in the Grapher, though altering the display color space to something like Jab or OKLab will. By default, the Grapher works in D50 Lab, and all graphed color differences are effectively delta-E 1976 which is the simple calculation of the 3D distance between any two points. Delta-E coloring however, will alter the color-coding of the vectors drawing your attention to the shifts which are likely to cause the most problems.
delta-e coloring
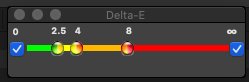
To aid in determining which color shifts are more severe than others, ColorThink can color pixels, patches and vectors according to 4 different error ranges. If you have determined a ‘shop standard’ amount of acceptable and unacceptable color shift you can key these values into the dE Floater window and quickly see in your images and color lists when you have exceeded your minimum quality levels.
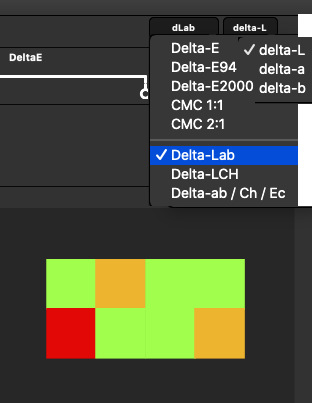
delta-Lab & delta-LCH Coloring Popup Menu
If delta-Lab or delta-LCH are selected as the delta-E formula the delta-E Coloring popup menu will be enabled. Choose one of the dimensions (L, a or b OR L, C or H) to be colored.
In this particular mode, errors can be positive or negative (eg Lightness might increase or decrease the L value creating positive or negative differences). ColorThink uses a gray-scale display technique where zero-error is a mid-tone gray and positive error lightens the gray tone while negative error darkens the gray tone.
When the delta-E column is activated a small floating palette, the delta-E Floater appears.
Drag the colored dividers to adjust which ranges of delta-E errors will receive which colors. Colors affected by delta-E coloring include:
Colors in the delta-E image region
Color patches in the delta-E Colors list region
Vector colors in the Grapher
The delta E bracket
As the Color Worksheet is a very flexible tool, there are many different sets of colors you might want to compare.

When the delta-E column is active, a bracket depicting the ‘begin’ and ‘end’ points of the dE comparison appears in the Workflow region. By default, the bracket will select the beginning and end of a single-workflow worksheet and will select the ends of a multi-workflow worksheet. It’s easy to modify this by just clicking and dragging the ‘begin’ and ‘end’ points of the bracket to other transforms. Once released over a difference transform, ColorThink will recalculate the new color differences.
Display delta E Reports
To obtain a statistical summary of the errors in the delta-E list, click the Report button in the Colors area and ColorThink will run standard statistical summaries in a separate report window. Note that the delta E button must be on in order to enable the Report button.