.png)
Colors and Color Lists
In the world of color reproduction, color lists are files used to describe a target to be measured, or the results of a measurement, sets of color pallets, and much more. Typically device settings (RGB, CMYK, and so forth) are combined with CIE color readings (XYZ, Lab, etc) to describe a list of colors and often to create an ICC profile. In most profiling applications, these color lists can be exported for use within ColorThink as well as exported from ColorThink for use within profiling and other apps. ColorThink has powerful tools to enable color lists to be extracted, combined, subtracted and filtered in many ways.
Color lists can contain a mixture of device (RGB, CMYK, etc), Colorimetric (Lab, XYZ, etc) and spectral data.
Example of a color list
For a very simple example color list that can be read by ColorThink, see example of a color list in the documentation for the Grapher.
Opening Color Lists
Select “File Open” and choose a text-based color list or
Drag a color list onto the menu bar or
Export a list of colors from a Named Color Profile (NCP) in the Profile Inspector.
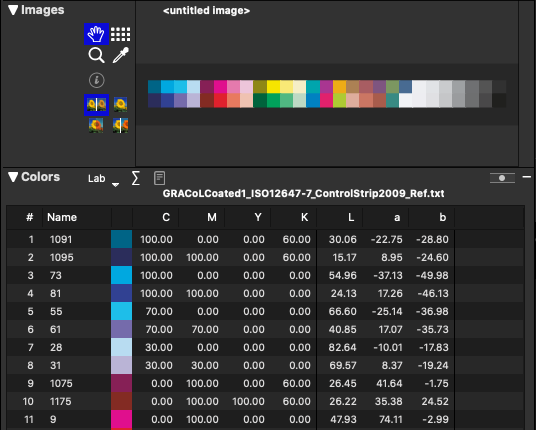
ColorThink displays the color list in the Colors region of the worksheet. If the list file contained sample numbers and names they’re displayed also.
For colors that contain colorimetric (Lab, XYZ, etc) or spectral values, ColorThink calculates a color patch for accurate display in the list (within monitor gamut limitations).
Saving Color Lists
To save a color list to disk, click on the list popup name above the list (it might be named “untitled” if it is a newly-created color list), and select Save List As...
A dialog provides options for which of the transform’s data sets should be saved in the file and the preferred units. ColorThink saves the list data to disk as a CGATS-format text file, a .cxf file, or an .mxf file (for use within i1Profiler).
ColorThink opens and saves files in the following colorimetric color units / models:
Lab, Jab, OKLab, LCH (Lab), Luv, XYZ, Yxy
Graphing Color Lists
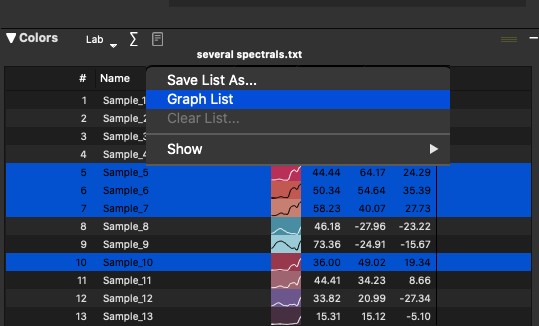
Clicking on Graph List sends the points of the color list to the grapher and opens the grapher for viewing.
Specific points in the color list can be highlighted using common conventions:
Shift-click to select a range
Control-click to select individual points (Windows)
Command-Click to select individual points (Mac)
Highlighted points in the color list are marked in the grapher with cross hairs to identify their position.
List & Color Processing
Filtering Colors by Gamut
PrePressPack Feature 
In ColorThink 4.1 and later, filtering is available to show and hide colors depending on their in-gamut or out-of-gamut position relative to an ICC profile gamut.
Follow these steps:
Open a list of colors into the worksheet (if you have i1Profiler installed, open the ColorAssets window and it will have found the available Pantone libraries in the left sidebar, double-click to open one of them, otherwise open an external list file into ColorThink)
immediately above the color list items is a new filter button - it looks like a funnel. Click it.
in the Filter popup, click + to select the profile you want for the gamut boundary
after a moment, the list will be filtered by either in gamut or out of gamut positions of the colors.
note the color count @ the bottom of the worksheet now shows the number and % of the selected colors - either in or out of gamut
** ColorThink filters by the actual color position relative to the gamut surface, not by delta-E like Photoshop’s gamut warning and other tools.
make a note of the number of colors when 'In Gamut' is selected in the filter dialog
select Out of Gamut in the filter dialog
Map list white point
PrePressPack Feature
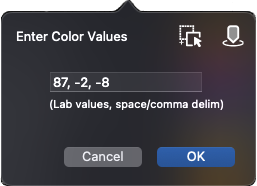
Using the SCCA method (Substrate Corrected Color Aim), the values in the color list can be recalculated with a different white point. Enter the desired white point using Lab values, separated by commas, drag-drop/open a color list or ICC profile to automatically grab its white point, or click the measurement icon to measure a white point directly.
Reorder List using current sort
Pro Feature
Click the Worksheet column headings to order from lowest to highest, or highest to lowest. For example, click the “L” column heading two times and the Worksheet rearranges all the patches to have the color list ordered from the highest “L*” value (at the top of the list) to the lowest. This changes the color list arrangement on screen, but does not affect the image area, and will not change the order of patches when saved to file…. unless
Reorder List using the current sort applies the current ordering to the underlying color list itself and the image area then reflects the change. Saving the color list to file retains the new arrangement of the same patches.
Reorder List using…
Pro Feature
Similar to Reorder List using current sort, use Reorder List using… to order your list according to a separate file. For example, if you have a scrambled measurement of an IT8.7/5 chart, and you wish to see what the measurement would look like in the visual layout (unscrambled), choose Reorder List using… and pick an unscrambled target reference file. ColorThink rearranges the target according to the ordering and layout of the second file. Note that this function works with the device values present in the files (for example: RGB, or CMYK values). It will not reorder color lists according to Lab values or spectral values.

Append to List…
Pro Feature
Add to the existing color list by selecting another color list (must be in the same color space as original).
Subtract from List using…
Pro Feature
Remove color that intersects. Remove colors from the existing color list who’s device values are also present in the second list. Wondering which patches in the IT8.7/5 (TC1617) are not in the IT8.7/4? Just open the IT8.7/5, select Subtract from List using… and the IT8.7/4 target and then left-over patches are the difference!
Select from List using…
Pro Feature
Only keep colors that are common. Remove any colors that are not present in both the original and the selected color list. Have target that’s a hybrid of two or more patch sets? Select from List… extracts the patches matching another file.
Remove duplicates
Pro Feature
Removes any patches with duplicate device values. As of version 4.2, duplicate patches are averaged together before being reduced to a single patch (we use the term reduce for this function in a number of our software products)
Tune device values…
PrePressPack Feature
ICC profiles are usually not created for the most accurate colors; they must create smooth color transitions - in other words, make continuous-tone images look good. For this reason, brand colors that you want to reproduce as accurately as possible are not at their best after a normal profile conversion.
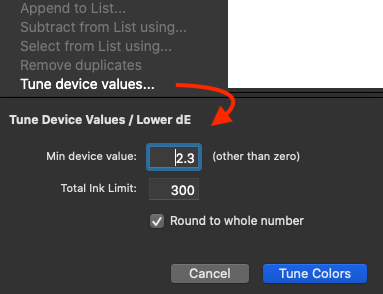
ColorThink uses the profile to fine-tune the device values to create colors as close as possible to the original (according to the profile). A transform between two profiles in the Worksheet is required for this function to be available.
Set the minimum device value to avoid scum dots, and the total ink limit imposed on blends to avoid over inking - tuning uses as much ink as is available and will go over the profile’s inking limit (for better or worse) without this setting.
Color list display options
Color values in lists can be displayed using many industry color values.
Options include:
Lab
Jab
OKLab
LabLCH
XYZ
Yxy
Luv
Density
Spectral (shown within the patch)

Total Area Ink Coverage
This button opens a column calculating the total area of ink coverage for each entry in the list. (Not relevant for RGB color lists.)
Report
This button calculates a delta E report (when delta E function is active).
Converting Between Images and Color Lists
ColorThink blurs the difference between images and color lists. Images can be displayed as lists of colors and color lists are displayed as images in the ‘Images’ region.
ColorThink can also explicitly convert from one data type to another:
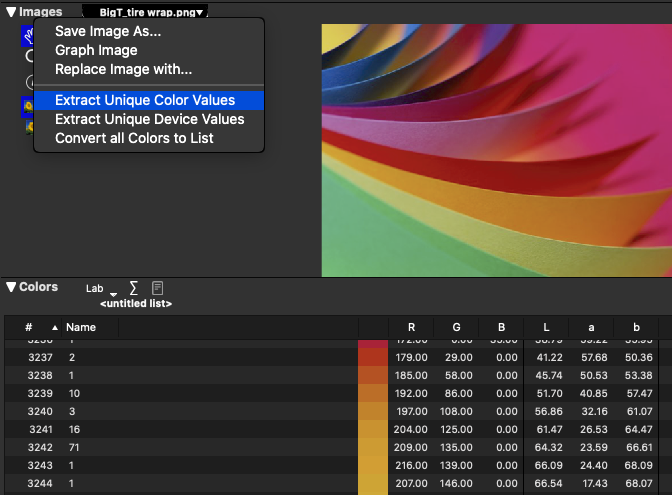
Select Convert All Colors to List from the image popup menu. (This converts every pixel in the image into an entry on a color list.)
Select Extract Unique Color Values. (This extracts only the colors that are unique and place them in a color list.)
Select Extract Unique Device Values
Use the Target Marquee to select specific colors in a target layout
To convert an image into a color list
Do one of the following:
See the section Working with Images for more information.
A color list is created in the "Colors" section. The number, name and color information are filled out automatically. The name is set to the number of times that color appears in the image. The name column in a list of colors made using the target marquee represents the x/y coordinates where that color appears in the image.
We also recommend clicking the new (untitled) color list popup and selecting "Use as primary data source" from the list popup menu. The image file is closed and the list itself becomes the data for the target displayed in the image area.
To convert a list to an image
Lists are automatically displayed as images when the Image region is shown.
Choose Save Image As... from the image popup menu to save the image to disk as a .TIFF file. Each patch is saved as a single pixel in the file. If you want a full-sized target, enlarge the image in Photoshop or another app using the Nearest Neighbor method - retaining the sharp boundaries between patches.