.png)
Profiles in the Grapher
Plot As: Surface
When plotting profiles, ColorThink shows the device gamut described by the profile using a gamut surface shape (for 3D graphs) or a gamut projection / outline (for 2D graphs). The appearance of that surface can be in three different styles:
Wireframe is the simplest plot and joins the vertex points together using lines. Linearity/calibration of the profiled device shows as differing spaces between the lines.
Flat Each polygon on the gamut surface is rendered using a single, solid color. This effectively shows the gamut surface, the linearity/calibration of the device and the color representation of the locations in the selected colorspace.
Smooth Each polygon’s color is rendered smoothly, blending the different corner colors across the surface of the polygon. This is the most accurate color rendering of the surface of the device gamut but at the expense of gamut surface detail.
Resolution
Some profiles might have small fluctuations along the gamut boundary. In these cases a higher resolution can be selected to provide more precise gamut calculations. Be aware, however, that the choice of a more precise resolution (5% or 1%) will require more processing time, and it may take longer to create the gamut plot.
Minimum creates a gamut shape using only the 100% primary and secondary colors, plus a black point and a white point. The minimum resolution setting can be useful in comparing ColorThink 2D graphs with other elementary graphs which are limited to basic hexagonal shapes. Using minimum superimposed on the same profile displayed as points can aid in demonstrating hue "hooking".
To change profile surface resolution:
At the "Res" drop-down box...
Choose a different resolution step (Minimum, 25%, 10%, 5% or 1%)
Device Gamut
By default, ColorThink will graph the device gamut of an output profile. This will give the most accurate representation of what the particular device (ie: printer, press) is capable of. This graphs the color as it is delivered to the profile connection space (PCS). This is known as the A to B (or the RGB/CMYK to Lab) transform of the profile. Another way to put this is that you're looking at the proofing action of the profile (rather than the printing action). By default, the Device Gamut radio button is selected.
Choosing any of the rendering intents with the other radio button will change the graph to display other rendering intents in the A to B transform. Please note that this is the A to B transform shown, the conversion to Lab. It is not the B to A transform. (This setting can be useful for some who are evaluating part of a profile's tables or in showing how data is handed off to the second profile in a transformation, but this is a very advanced, technical use - and of limited use in workflow analysis.) This graph does not show what effect different ink limiting or black generation will have on the printing. These are represented in the B to A side of a device profile.
Rendered Gamut New in 4  Pro Feature
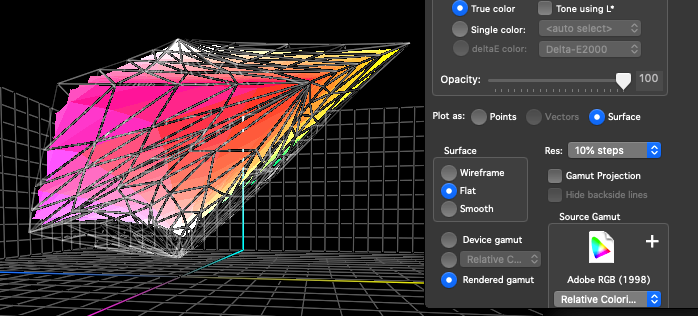
A new feature in ColorThink 4 allows the viewing of the rendered or “printing” direction of an output profile. This shows the effect of the B to A transform.
For RGB profiles, the device gamut and the rendered gamut will likely be very similar. Because of different black generation and ink limiting choices, CMYK profiles might look very different between the device and rendered gamuts. In some cases, theis might be natural and expected. In other cases, a disparity in shape can be the result of a poorly constructed profile.
The process of printing involves a transform between two profiles. In order to display a rendered gamut, the process needs to know what the source or input profile would be. Use the “Source Gamut” section to indicate what the input profile would be. For example, if a company typically uses AdobeRGB as the working space, and prints using Relative Colorimetric, then make those selections in the Source Gamut section to simulate that printing gamut.
Hint
View Measurement Data New in 4
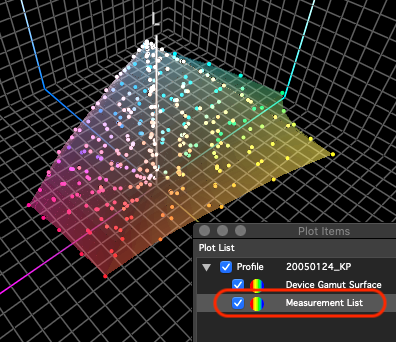
For profiles that include measurement data in the tag table, ColorThink makes it easy to display this measurement color list.
Find the Measurement list in the subplot items and click the checkbox to turn on viewing. All the options available for other color lists are available here, including changing opacity, point size & shape, etc.
Constrain Channels
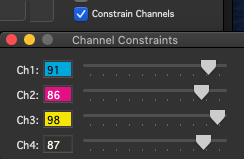
The Constrain Channels feature plots a surface as if each ink channel had been limited according to the values of the slider.
Possible uses:
Learn more about how color is created. (For example: remove black and see how gamut of the device changes.)
Overlay a proofing system gamut with a press gamut, constrain the proofer ink channels to reduce its gamut until its gamut approximates (just contains) the press gamut. This can be beneficial to proofing systems by reducing the oversaturation which contributes to hue shifts that sometimes occur in inkjet printers.
While this is primarily intended for CMYK and nColor profiles, the constrain channels feature is also available for RGB profiles, to help learn or demonstrate how red, green and blue additive channels make up the profile.
 Try out the "Evaluate Optimal Device Ink Limits”
 guide in the ColorSmarts Guide to see this function in practice.
Multi-Channel Profiles Improved in 4 PrePress Feature
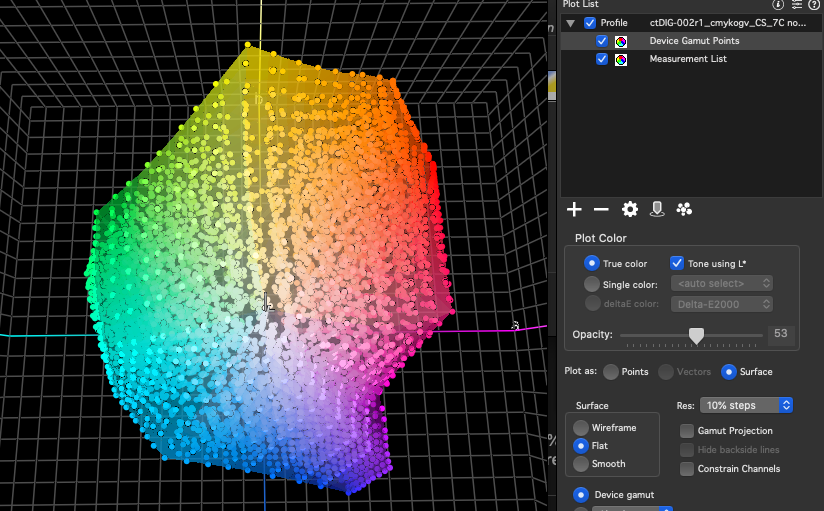
Click to enlarge
With every additional color channel added to a profile, the complications involving calculating it grow exponentially. Until now it has been very difficult to properly reproduce a multi-channel profile in three dimensions. Much work has been done to accurately portray profiles involving 5-, 6-, 7- and even 8 or more different ink colors.
When working these kinds of profiles, understand that more computation is involved. Please allow more time for larger profiles to load and display.
All of the same 3D functions available for other profile types are available for multi-channel profiles. Features such as Constrain Channels or Plot as Points can provide a great deal of useful information about the functions of a multi-channel profile.
Multi-channel workflows are not as common in the industry as CMYK workflows. Be sure to contact us at CHROMiX with any specific questions or feature requests.
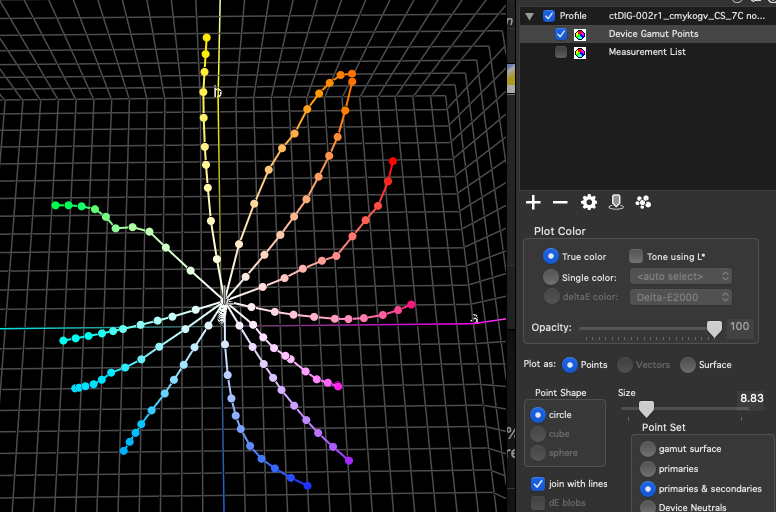
Plot As: Points
Plotting profiles as points derives and displays colors in the same manner as the profile surface is calculated. Isolate primary and secondary ink channels, neutral rendering values and even the surface edge Girdle created when mixing primary and secondary (overprint) colors (Pro feature).
Plotting a profile as points and using a filtered point set allows you to identify the action of the individual inks in an inkjet printer. Use in conjunction with "connect with lines" to visually see problems such as hooks in ink saturation, linearization problems, black and white printing color casts and more
Point shapes can be either squares, cubes or spheres.
The Size slider changes the size of each color point plotted.
Join with lines will attempt to connect adjacent points with lines. See Color Lists in the Grapher for more details about joining with lines. Joining a gamut surface of points is not the same as graphing a gamut surface in wireframe mode. In fact, Join with Lines is disabled in this particular situation in order to avoid confusion.
Point Set provides a choice between...
The points on the surface of the gamut,
Primary color ramps (eg Cyan, Yellow, Magenta and Black) within the profile, isolating each ink channel and sampling it between 0 and 100%.
Primary and secondary color ramps (eg adding Red, Green, Blue overprints to CMYK) within the profile. This is often called a “Spider Plot” - select a profile plot item and then select Add Spider Plot from the gear/action menu for a shortcut.
Device Neutral colors (grays). For RGB profiles, isotonic (equal RGB values) are used. For CMYK and nColor profiles, the standard neutral-balanced CMY values are used (ie, where the mid tone is CMY = 50, 40, 40)
Gamut Girdle New in 4
The Gamut Girdle is the imaginary line traced at a gamut surface’s edge between 100% primary colors, to 200% secondary/overprint colors, and to the next 100% primary color. For example, 100% yellow as a starting point, then magenta is added until the 200% yellow+magenta point is reached. Continuing on, yellow is subtracted until only 100% magenta is reached. This cycle is repeated, adding cyan, removing magenta, adding yellow and finally, removing cyan until the 100% yellow starting point is reached. The resulting line that traces around the entire gamut is often called a Girdle in the color world.
For CMYK it can be illuminating to see how the outer, most saturated color boundary is created, but it can also reveal calibration issues that cause some ink channels to reverse themselves chroma-wise, creating darker but less saturated colors. This is often considered a calibration problem (though some don’t agree) and it makes the girdle wrap under the gamut edge. Whether you agree it’s a problem or not, girdles quickly show what’s happening at the gamut boundary.
Girdles for nColor systems can be even more interesting. As you explore, say, a 7-ink printing gamut, it’s interesting to see how primary, secondary, tertiary etc ink combinations work together to produce the large gamut that’s available. Use the Girdle Level Control popup to select each type of these girdles and evaluate your ink set capabilities.
Girdle Boundary Pro Feature
Girdle Level Control PrePress Feature
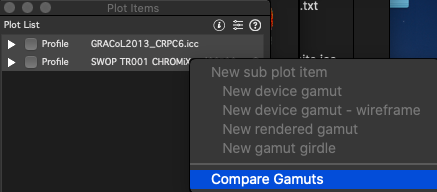
Compare Gamuts New in 4 Pro Feature
ColorThink now allows the user to compare profile gamuts by adding or subtracting parts of two gamuts.
ColorThink will calculate the gamut size, and compare or contrast the two gamut shapes, providing a statistical analysis of the gamut volumes.
To compare gamuts:
Select any two profiles and either:
Right+click the selected gamut,
Click the gear menu, or
Click the
 button to the right of the profiles in the plot list
Choose Compare Gamuts

The Plot Item Inspector displays:
A ven-style diagram showing the approximate area of each gamut, how much each gamut intersects with the other.
A numeric gamut volume value for each profile.
A Gamut Comparison Index (GCI) showing the percentage of each profile compared with the other.
The Plot List menu includes more options. The Compare function can be used to:
Subtract the second profile in the list from the first (A-B)
Subtract the first profile from the second (B-A)
Identify the section of the gamut that both profiles share in common (A&B)
Show the gamut of both profiles together (A+B)
Example
Compare input profile to press profile
Using your company working space profile (or input profile) with the profile of your press to see what colors are unavailable to be printed by your press - or what colors are cut off of your workflow by your input profile.
Compare monitor profile to printer profile
(For photographers:) Compare your monitor profile to your inkjet printer to see what colors you can see on screen that are not able to be printed.
Check out the ColorSmarts Guide section of ColorThink as many of these functions are automated.